
WTO: 2013 NEWS ITEMS
REPORTS ON RECENT TRADE DEVELOPMENTS
MORE:
> Joint Summary on G-20 Trade and Investment Measures (OECD/WTO/UNCTAD)
> WTO Report on G-20 Trade Measures
> Summary and Status of G-20 trade and trade-related measures since October 2008 (Excel Format)
> OECD/UNCTAD Report on G-20 Investment Measures
Summary of WTO Report on G-20 Trade Measures
(Mid-May 2013 to mid-November 2013)Trade restrictive measures increase as trade flows slow down
World trade growth in 2013 is slower than expected
Global economic growth remains slow and uneven, not only in most developed economies but also in major emerging markets. The shortfall in activity has weighed heavily on world trade flows. Trade growth this year is expected to register only a slight increase over 2012, and although prospects are improving the forecast for next year is still below the historical trend. The volume of world merchandise trade is expected to grow by 2.5% in 2013 and 4.5% in 2014.
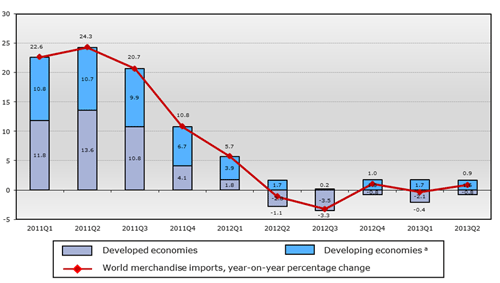
Contributions to year-on-year growth in world merchandise imports, 2011Q1 - 2013Q2
(percentage change in US$ values)
The number of new trade restrictions has increased
In the last six months, most G-20 members have put in place new trade restrictions or measures that have the potential to restrict trade. The trend is towards more restriction. 116 new trade restrictive measures were identified since the last WTO report, up from 109 measures recorded for the previous seven-month period. These were mainly new trade remedy actions, in particular the initiation of anti-dumping investigations, tariff increases and more stringent customs procedures. New measures affect around 1.1% of G-20 merchandise imports, equivalent to 0.9% of world merchandise imports.
The trade restrictive or distorting effects of behind-the-border measures, such as subsidies, public procurement activity and goods and services regulations, are more difficult to measure. These are more varied than border measures, their effects on trade are usually more indirect, and they are harder to monitor, particularly those applied at sub-federal levels and where implementation involves administrative discretion. All of these measures can affect trade, but for the purposes of this Report the key question is whether they are being used deliberately to restrict or distort access to domestic markets. In the case of new TBT and SPS regulations, where data is more available, 2 to 3% of the thousands that are notified each year to the WTO are taken up by Members for closer scrutiny on the grounds that they raise specific trade concerns, and that proportion has not significantly changed over the past six years.
Better transparency and more evidence are needed to evaluate properly the trade impact of behind-the-border measures.
Trade restrictive measures
Type of measure |
Mid-Oct 10 to Apr 11 (6 months) |
May to mid-Oct 11 (6 months) |
Mid-Oct 11 to mid-May12 (7 months) |
Mid-May to mid-Oct 12 (5 months) |
Mid-Oct 12 to mid-May13 (7 months) |
Mid-May to mid-Nov 13 (6 months) |
Trade remedy |
53 |
44 |
66 |
46 |
67 |
70 |
Import |
52 |
36 |
39 |
20 |
29 |
36 |
Export |
11 |
19 |
11 |
4 |
7 |
8 |
Other |
6 |
9 |
8 |
1 |
6 |
2 |
Total |
122 |
108 |
124 |
71 |
109 |
116 |
Average per month |
20.3 |
18.0 |
17.7 |
14.2 |
15.6 |
19.3 |
Fewer trade liberalising or facilitating measures were taken than in the past
Some G-20 members also took measures that facilitate trade, although fewer than in the period covered by the last report. Around 33% of the total recorded measures can be considered as trade facilitating, compared with 40% at the time of the previous trade monitoring report. Facilitating measures are mainly in the form of termination of trade remedy actions and tariff reductions. These measures cover around 0.8% of G-20 merchandise imports and 0.6% of world imports.
Trade restrictions continue to accumulate
The accumulation of trade restrictions continues. This is a result of more new measures being taken during the most recent period. This time the rate of removal of restrictions put in place since the outbreak of the global crisis is slightly higher than in the previous period. Around 20% of the total number of trade-restrictive measures taken since October 2008 has so far been eliminated; this compares with 19% at the time of the previous report in June 2013.
All import-restrictive measures adopted since October 2008, excluding those that have been reported as terminated up to mid-November 2013, are estimated to cover around 3.9% of world merchandised imports, and around 5% of G-20 imports.
G-20 economies should show leadership in reinvigorating the multilateral trading system
Strong leadership by the G-20 economies is crucial for the world, in particular to move forward on the positive momentum generated by the adoption of the Bali package. The success in the WTO's 9th Ministerial Conference should not be the end of the road, but the beginning of the process towards conclusion of the Doha Round. The multilateral trading system must be reinforced and strengthened to help global trade liberalization continue and so that trade rules are updated to reflect the issues of the 21st century.
The multilateral trading system remains the best defence against protectionism and the strongest force for economic growth, sustainable recovery and development. The system has proved its usefulness as an insurance policy against protectionist tendencies. Protectionist pressures are bound to remain in a context of slow uneven economic recovery and persistent high levels of unemployment. In this period, it is all the more important to put the spotlight on trade as a source of growth, employment creation and development.
> Problems viewing this page?
Please contact [email protected] giving details of the operating system and web browser you are using.