Exports from developed economies are expected to
increase by 7.5% in volume terms over the course of the year while shipments
from the rest of the world (including developing economies and the Commonwealth
of Independent States) should rise by around 11% as the world emerges from
recession.
This strong expansion will help recover some, but by no means all, of the ground
lost in 2009 when the global economic crisis sparked a 12.2% contraction in the
volume of global trade — the largest such decline since World War II. Should
trade continue to expand at its current pace, the economists predict, it would
take another year for trade volumes to surpass the peak level of 2008. Measuring
trade in volume terms provides a more reliable basis for annual comparisons
since volume measurements are not distorted by changes in commodity prices or
currency fluctuations, as they can be when trade is measured in dollars or other
currencies.
One positive development in 2009 was the absence of any major increase in trade barriers imposed by WTO members in response to the crisis. The number of trade-restricting measures applied by governments has actually declined in recent months. However, significant slack remains in the global economy, and unemployment is likely to remain high throughout 2010 in many countries. Persistent unemployment may intensify protectionist pressures.
“During these difficult times, the multilateral
trading system has once again proven its value. WTO rules and principles have
assisted governments in keeping markets open and they now provide a platform
from which trade can grow as the global economy improves. We see the light at
the end of the tunnel and trade promises to be an important part of the
recovery. But we must avoid derailing any economic revival through
protectionism,” said WTO Director-General Pascal Lamy.
Why was the trade decline so large?
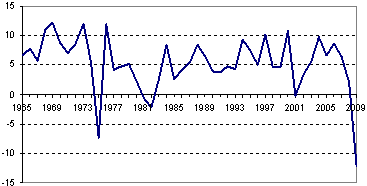
The 12% drop in the volume of world trade in 2009 was larger than most
economists had predicted. This contraction also exceeded the WTO’s earlier
forecast of a 10% decline. World trade volumes fell on three other occasions
after 1965 (—0.2% in 2001, —2% in 1982, and —7% in 1975), but none of these
episodes approached the magnitude of last year’s economic slide (Chart 1). Trade
in current US dollar terms dropped even further than trade in volume terms
(—23%), thanks in large part to falling prices of oil and other primary
commodities.
Economists have suggested a number of reasons why trade declined so steeply,
including the imposition of some of protectionist measures. But the consensus
that has emerged centres on a sharp contraction in global demand as the primary
cause. This was magnified by the product composition of the fall in demand, by
the presence of global supply chains, and by the fact that the decline in trade
was synchronized across countries and regions(1). The weakness in private sector
demand was linked to the global recession triggered by the sub-prime mortgage
crisis in the United States. What began in the US financial sector soon spread
to the real economy, with global repercussions. Limited availability of trade
finance also played a role.
Chart 1: Volume of world merchandise exports, 1965-2009
(Annual % change)
Source: WTO Secretariat.
Sharp falls in wealth during the recession caused households and firms to reduce
their spending on all types of goods, especially consumer durables (e.g.
automobiles) and investment goods such as industrial machinery (Table 1).
Purchases of these items could be postponed easily in response to heightened
economic uncertainty, and they may also have been more sensitive to credit
conditions than other types of goods.
Whatever the reason for their decline, the reduction in demand for these
products fed through to markets that supply inputs for their production,
particularly iron and steel. Falling demand for iron and steel was also linked
to the slump in building construction in countries where property markets had
been booming before the crisis (e.g., the United States, the United Kingdom,
Ireland and Spain).
The fact that some products comprise a disproportionately large share of world
trade, compared with their share of overall output, may have further depressed
world trade flows relative to overall production (GDP or gross domestic
product). For example, consumer durables and investment goods make up a
relatively small fraction of global output but a relatively large part of world
trade. Consequently, a decline in demand for these products would have had a
greater impact on trade than on GDP.
Table 1: Quarterly growth in world trade in manufactures by product,
2008Q1-2009Q3
(y-o-y percentage change in current US dollars
|
2008Q1 |
2008Q2 |
2008Q3 |
2008Q4 |
2009Q1 |
2009Q2 |
2009Q3 |
|
|
|
|
|
|
|
|
Manufactures |
15.7 |
18.6 |
13.2 |
-10.4 |
-27.6 |
-29.8 |
-21.5 |
Iron and steel |
14.6 |
27.0 |
42.7 |
5.4 |
-37.3 |
-54.7 |
-55.0 |
Chemicals |
19.3 |
24.5 |
21.7 |
-5.9 |
-23.5 |
-24.4 |
-16.6 |
Office and telecom equipment |
10.0 |
13.2 |
7.2 |
-13.9 |
-28.4 |
-22.2 |
-15.3 |
Automotive products |
15.3 |
15.8 |
3.4 |
-26.0 |
-46.9 |
-45.6 |
-28.6 |
Industrial machinery |
21.9 |
22.7 |
15.7 |
-7.3 |
-28.8 |
-36.0 |
-31.9 |
Textiles |
10.3 |
8.9 |
3.4 |
-12.8 |
-26.9 |
-26.8 |
-17.3 |
Clothing |
10.3 |
11.4 |
7.9 |
-2.5 |
-10.4 |
-15.5 |
-12.1 |
Source: WTO Secretariat estimates based on mirror data.
The measured decline in trade was also inflated to some extent by the spread of
global supply chains, in which goods may cross national borders several times
during the production process before arriving at their final destination.
Merchandise trade statistics record the value of goods every time they cross
national boundaries, so when these data are summed to arrive at a figure for
total world trade, the number will be larger in the presence of supply chains
due to a certain amount of double counting.
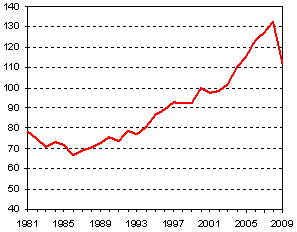
The extent of this double counting is difficult to gauge due to a lack of
readily available data, but it is reflected in the fact that exports have been
growing faster than production since the 1980s (Chart 2). This ratio has
increased steadily since 1985, and jumped by nearly one third between 2000 and
2008, before dropping in 2009 as world exports fell faster than world GDP.
Chart 2: Ratio of world exports of goods and commercial
services to GDP, 1981-2009
(Index 2000=100)
Source: IMF for world GDP, WTO Secretariat for world trade in goods
and commercial services.
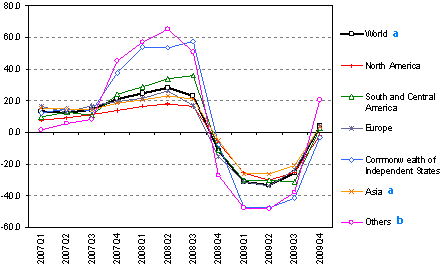
A final factor that reinforced the 2009 trade slump was its synchronized nature.
Exports and imports of all countries fell at the same time, leaving no region
untouched (Chart 3). It is intuitively clear that the fall in world trade would
have been smaller if contraction in some regions had been balanced by expansion
in others, but this was not the case.
The synchronized nature of the decline is closely related to the spread of
international supply chains and information technology, which allows producers
in one region to respond almost instantly to market conditions in another part
of the world. This usually contributes to global and national welfare by
encouraging the most efficient use of scarce resources, but in the case of the
trade collapse it may have spread the recession faster.
Chart 3: Growth in World merchandise exports trade by region
(Year to year % change in dollar values)
a Includes significant re-exports or imports for re-exports
b Includes Africa and Middle East. These regional totals are
significantly under-represented.
Sources: IMF, International Financial Statistics; Eurostat, Comext Database;
National statistics; Global Trade Atlas.
Trade prospects for 2010
World trade and output are currently in a recovery phase. The fall in global
output last year (—2.3%) was the first of its kind since the Great Depression in
the 1920s and 30s, prompting strong fiscal and monetary policy responses from
governments around the world.
Since these extraordinary measures appear to have succeeded in preventing a
downward spiral in the global economy, policy makers will eventually have to
turn their attention to the withdrawal of these policies.
Without any further upheavals in the global economy, world merchandise trade
should resume its normal upward trajectory through the end of 2010, although
some deviation from its previous trend line will persist indefinitely. The WTO
Secretariat estimates that world exports in volume terms will grow by 9.5%, this
year, while developed economies’ exports will expand 7.5% and the rest of the
world (developing economies plus the Commonwealth of Independent States) will
advance 11%. This projection assumes a resumption of global GDP growth in line
with consensus estimates (2.9% at market exchange rates), as well as stability
in oil prices and exchange rates. However, unexpectedly positive or negative
economic news in the coming months could necessitate a revision of the trade
forecast.
A 9.5% growth rate for trade is insufficient to bring about a return to
pre-crisis levels this year, and even the 11% rate forecast for developing
countries would not do the trick. However, two years of growth at this pace
would result in trade levels surpassing the peaks of 2008. Developed economies,
on the other hand, would require three years of growth to accomplish this.
These trade forecasts are more sensitive to changes in outcomes for developed
countries than for developing ones, due to developed countries’ larger share of
world trade.
There remain significant risks that the forecast could be over-optimistic,
including the possibility of further increases in oil prices, appreciation or
depreciation of major currencies, and additional adverse developments in
financial markets.
However, there is also a possibility that trade may outperform the forecast, for
example if unemployment rates fall more quickly than expected in developed
countries.
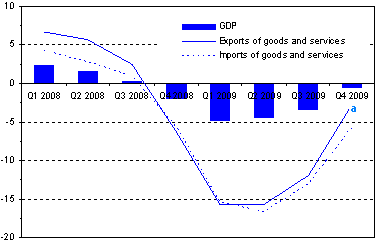
As can be seen in Chart 4, the estimates of export growth are supported by the
WTO Secretariat’s time series forecasting model(2), which predicts growth in
imports of around 9.5% in goods and services for OECD countries (technically “on
a balance-of-payments basis”).
Chart 4: Real GDP and trade growth of OECD countries, 2008-09
% change on a year to year basis
a Estimated based on available data.
Source: OECD Quarterly National Accounts.
Brief overview of trade developments in 2009
Trade data in volume (real) terms: merchandise
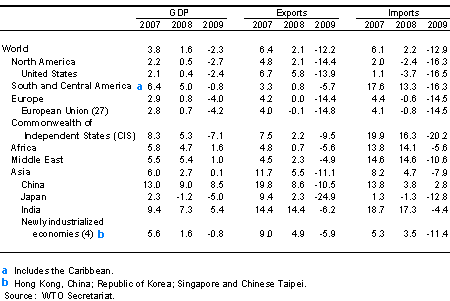
All countries and regions registered declines in the volume of their merchandise exports in 2009.
The United States (—13.9%), European Union (27) (—14.8%) and Japan (—24.9%) all
registered declines larger than the world average of —12.2%, while the smallest
declines were recorded by the oil exporting regions of Middle East (—4.9%),
Africa (—5.6%) and South/Central America (—5.7%). Asia (—11.1%) and China
(—10.5%) also saw their exports decline, but by slightly less than the world
average. (Table 2)
The situation was reversed on the import side, where the two largest declining
regions were oil exporters — the Commonwealth of Independent States (CIS)
(—20.2%) and South and Central America (—16.5%). Among the remaining countries,
the United States (—16.5%) and the European Union (—14.5%) had declines greater
than the world average, while Japan’s drop (—12.8%) was nearly equal to the
world rate.
Table 2: GDP and merchandise trade by region, 2007-2009
(Annual % change at constant prices (2005)
Trade data in value (nominal) terms: merchandise and commercial services
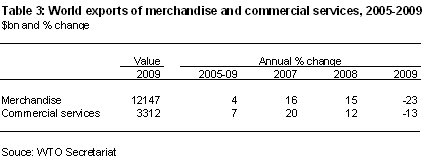
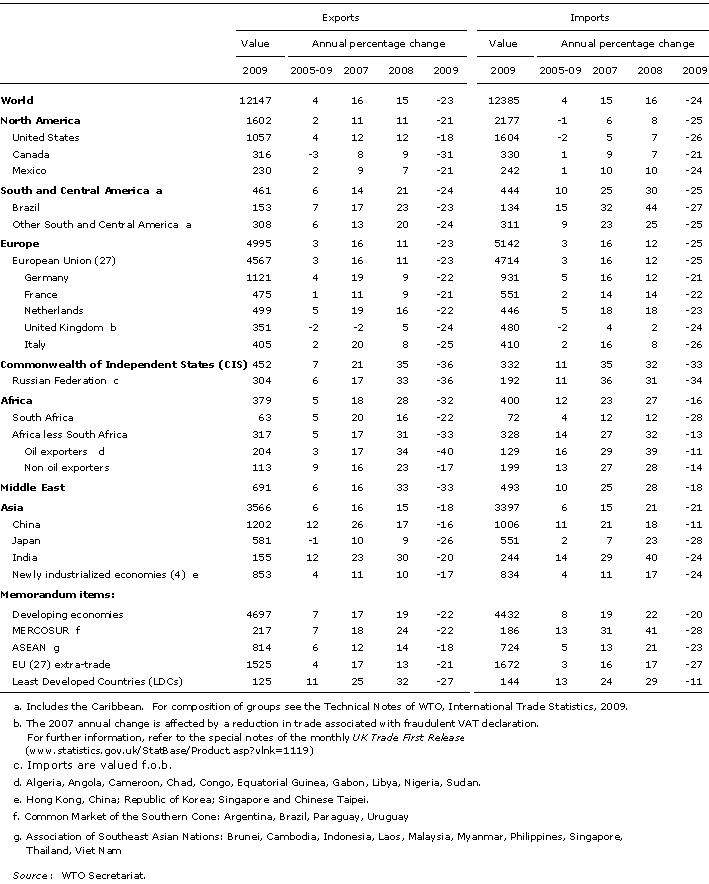
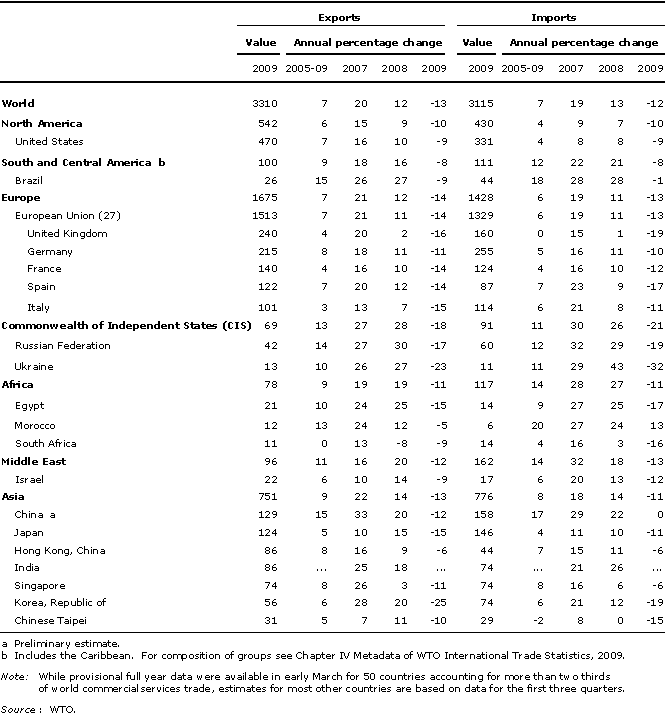
The value of world merchandise exports fell 23% to $12.15 trillion in 2009,
while world commercial services exports declined 13% to $3.31 trillion (Table
3). This marked the first time since 1983 that trade in commercial services
declined year on year.
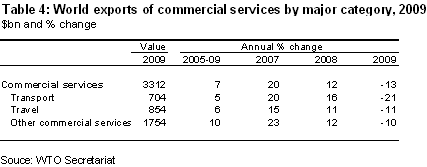
Transport services recorded the largest drop among service categories, followed
by travel and other commercial services (Table 4). The drop in transport
services is unsurprising as this category is closely linked to trade in goods.
(For more detailed information on trade by country and region, including leading
exporters and imports of merchandise and commercial services, see the appendix
tables below.)
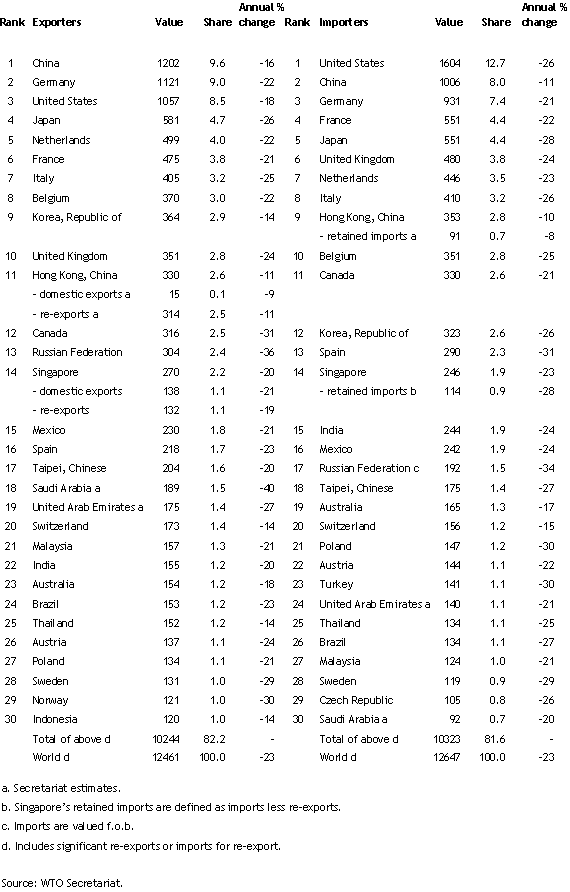
Appendix Table 3 confirms that China has now overtaken Germany as the world’s
leading merchandise exporter, accounting for almost 10% of world exports, and is
second to the United States on the import side. The US share in world
merchandise imports is 13% compared to China’s 8%.
Although the declines in export volumes of oil producing regions were less than
the world average in 2009, their declines in value terms tended to be larger.
For example, the dollar value of exports from the Middle East, Africa and
Commonwealth of Independent States fell by 33%, 32%, and 36% respectively,
compared to a drop of 23% for the world.
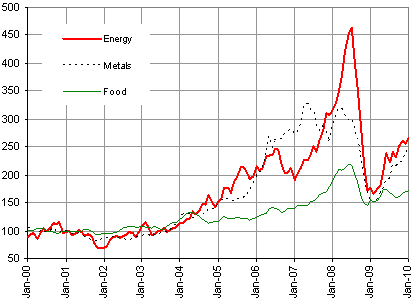
This was due to the sharp drop in oil prices between 2008 and 2009 (Chart 5).
Since oil tends to dominate merchandise exports of petroleum producers, it
should be noted that trade developments in value and volume terms may differ
substantially for individual countries in 2009.
Chart 5: Prices of selected primary products, January 2000—January 2010
(Indices, 2000=100)
Source: IMF Primary Commodity Prices.
> Download
this press release (pdf format, 16 pages,
125KB)
> Problems viewing this page?
Please contact [email protected] giving details of the operating system and web browser you are using.
APPENDIX TABLES AND CHARTS
Appendix Table 1
World merchandise trade by region and selected country, 2009
(Billion dollars and percentage)
Appendix Table 2
World exports of commercial services by region and selected country, 2009
(Billion dollars and percentage)
Appendix Table 3
Merchandise trade: leading exporters and importers, 2009
($bn and %)
Appendix Table 4
Merchandise trade: leading exporters and importers, 2009
(Excluding intra-EU (27) trade — $bn and %)
Appendix Table 5
Leading exporters and importers in world trade in commercial services, 2009
(Billion dollars and percentage)
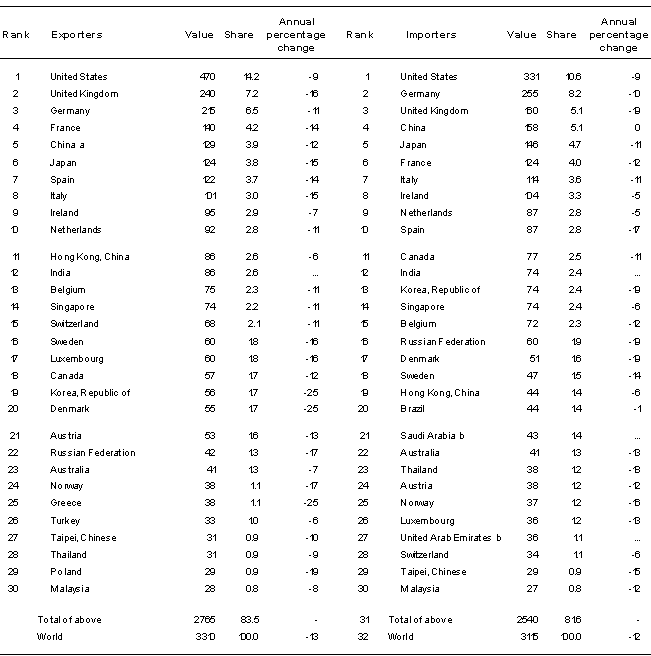
a Preliminary estimate.
b Secretariat estimate.
Note: While provisional full year data were available in early March for 50
countries accounting for more than two thirds of world commercial services
trade, estimates for most other countries are based on data for the first three
quarters.
Source: WTO
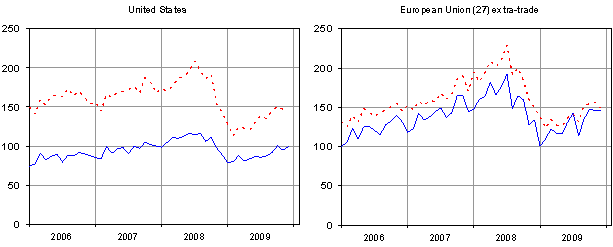
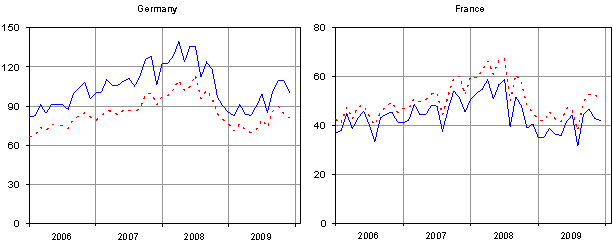
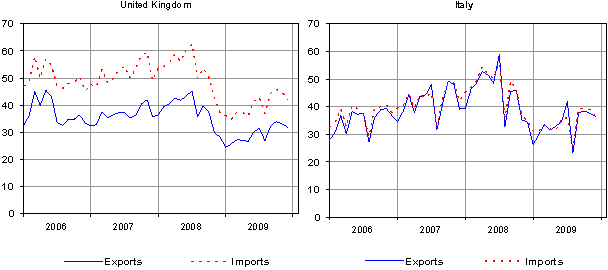
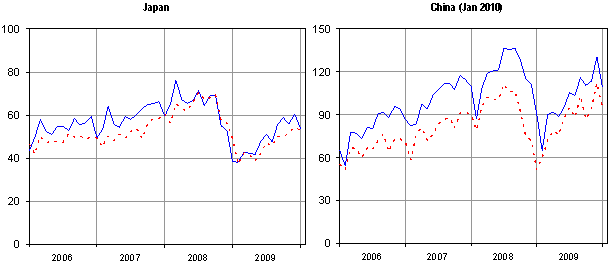
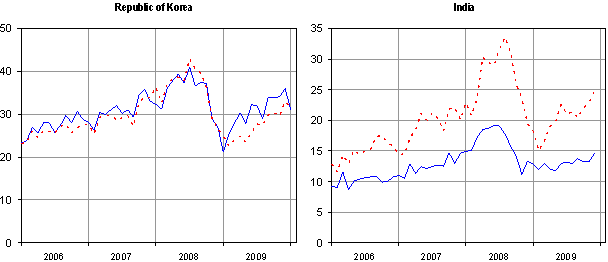
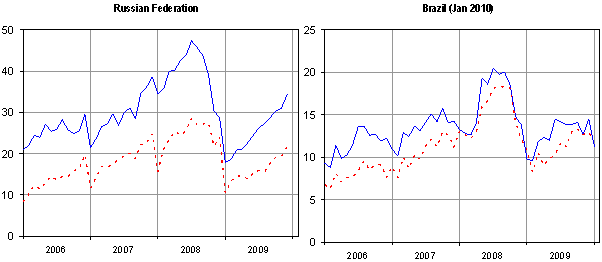
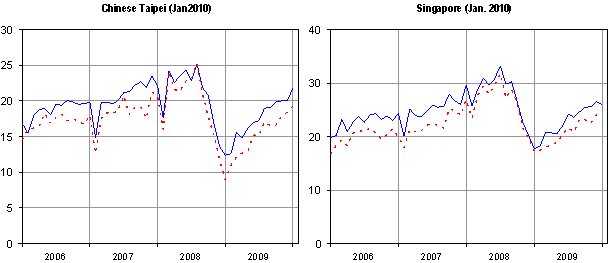
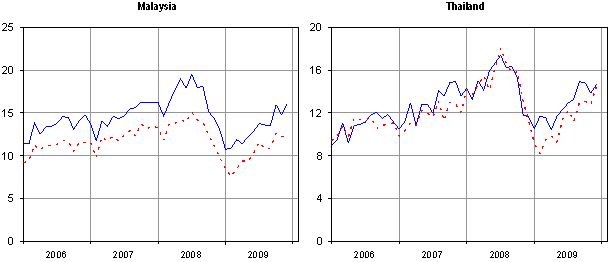
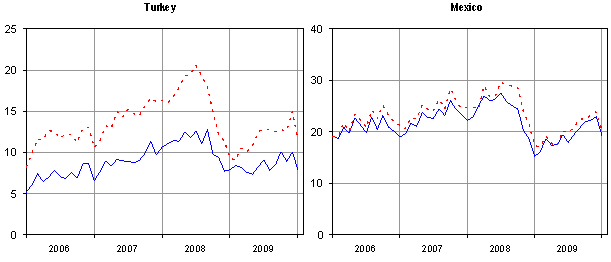
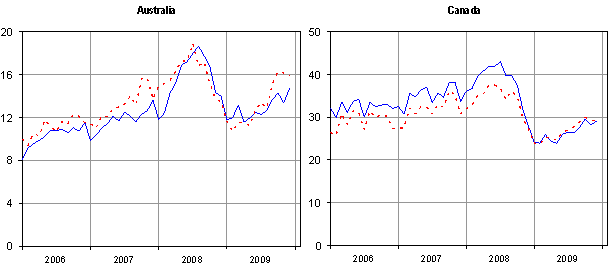
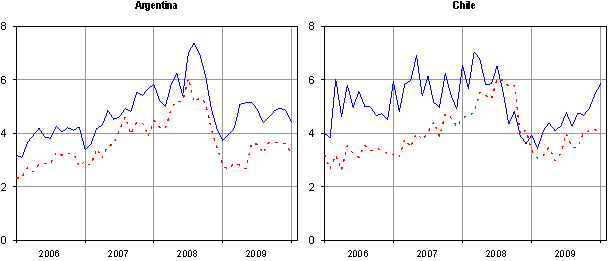
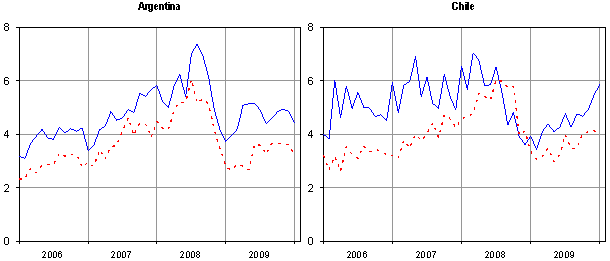
Appendix Chart 1
Monthly merchandise exports and imports of selected economies, January 2006 —
January 2010
(Billion dollars)
Notes:
1. For a comprehensive analysis of the causes of
trade contraction, see Richard Baldwin (ed. 2009), The Great Trade Collapse:
Causes, Consequences and Prospects, Centre for Economic Policy Research
(London). back to text
2. See Keck, A., Raubold, A. and Truppia, A. (2009)
“Forecasting International Trade: A Time Series Approach”, OECD Journal: Journal
of Business Cycle Measurement and Analysis, Vol. 2009/2: 1-20.
back to text
