MORE:
These short-term “value” figures should not be confused with the annual trade growth figures headlined in the 7 April 2011 press release, which are “volume” data using “constant dollars” with inflation taken into account.
Moreover, WTO short-term merchandise trade values are not seasonally adjusted. Seasonal patterns therefore considerably affect the quarter on quarter (Q-o-Q) and month on month (M-o-M) developments in world trade, and this in turn affects comparisons between the trade developments in individual regions and economies.
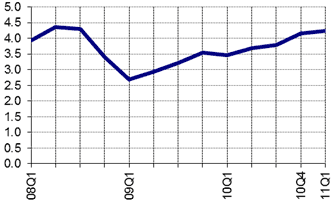
Chart 1: World merchandise exports, first quarter 2008 to first quarter 2011
Trillion dollars

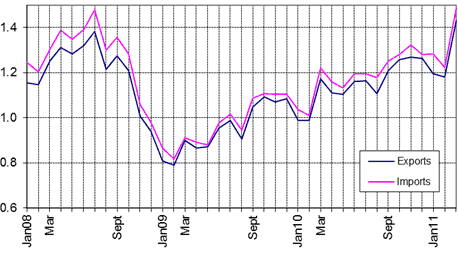
Available monthly statistics for about 70 economies representing more than 90% of world trade show that merchandise trade rose sharply in March 2011, reflecting in good part seasonal variations. The value of trade reached for the first time a level superior to the pre-crisis maximum of July 2008.
Chart 2: Monthly merchandise trade 2008-2011, aggregate of 70 economies a
Trillion dollars

a Imports are valued cif (cost, insurance and freight included) while exports are fob (free on board).
Overview of regional trade flows
Table 1: World merchandise trade by region and selected economies, January-March 2011
Percentage change in current US dollars, year-on-year and quarter-on-quarter
Exports |
Imports |
|||
Y-o-Y |
Q-o-Q |
|
Y-o-Y |
Q-o-Q |
22 |
2 |
World (a) |
22 |
2 |
19 |
1 |
North America |
19 |
1 |
18 |
1 |
United States |
19 |
1 |
17 |
3 |
Canada |
18 |
3 |
30 |
3 |
South and Central America |
27 |
-2 |
31 |
-10 |
Brazil |
25 |
-3 |
18 |
3 |
Europe |
20 |
4 |
19 |
3 |
European Union (27) (b) |
19 |
4 |
16 |
4 |
intra EU |
16 |
4 |
23 |
1 |
extra EU |
23 |
4 |
28 |
3 |
Commonwealth of Independent States (CIS) |
39 |
-14 |
24 |
1 |
Russian Federation |
41 |
-16 |
30 |
14 |
Africa and the Middle East |
11 |
-3 |
25 |
-2 |
Asia (a) |
26 |
4 |
26 |
-10 |
China |
33 |
5 |
42 |
16 |
India |
17 |
16 |
13 |
-5 |
Japan |
23 |
3 |
25 |
4 |
Six East Asian traders (c) |
23 |
5 |
|
|
|
|
|
a Includes significant re-exports or imports for re-exports.
b “Intra EU” is trade within the EU; “extra EU” is trade between the EU and non-EU economies
c Hong Kong, China (excluding re-export trade), Republic of Korea, Malaysia, Singapore, Chinese Taipei, and Thailand
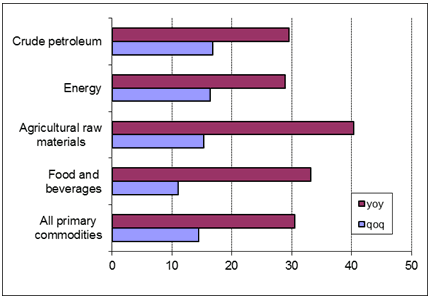
Chart 3: Commodity price developments, first quarter 2011
Percentage change

Source: IMF
> Problems viewing this page?
Please contact [email protected] giving details of the operating system and web browser you are using.
