INTERNATIONAL TRADE STATISTICS
More
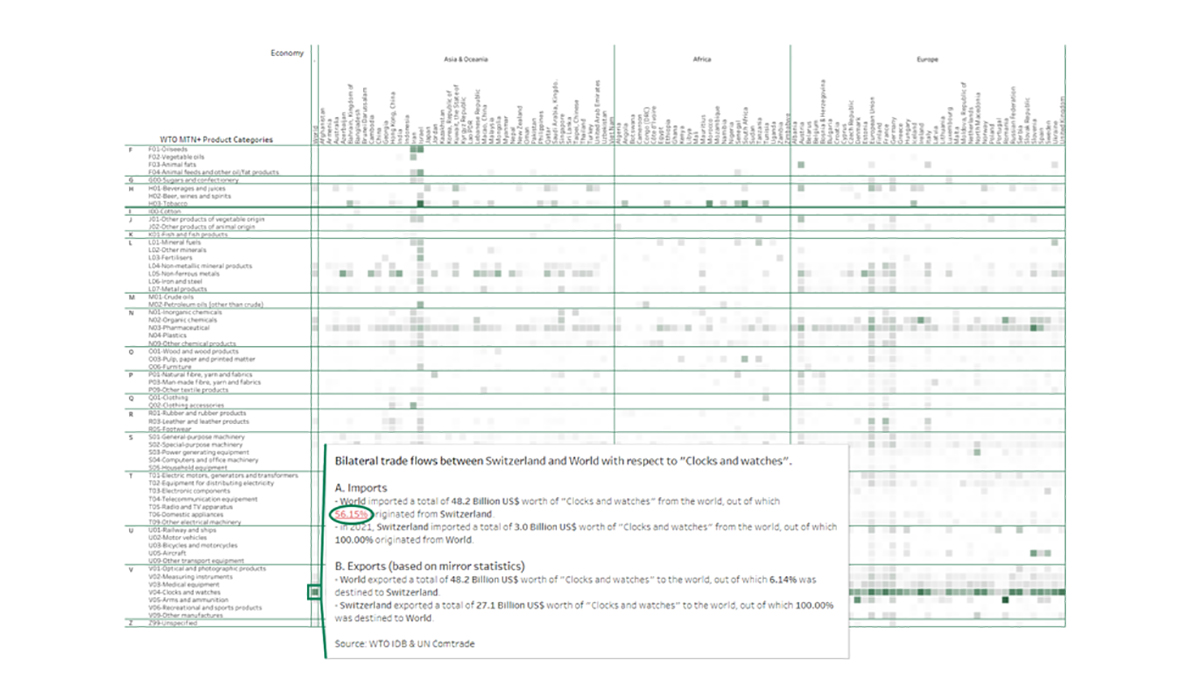
Available via the WTO Stats Dashboard, the Heatmap utilises bilateral trade flow data from more than 180 economies aggregated into around 70 product groups. When a user selects an economy from the drop-down menu, a heatmap is generated. Each square tile represents a share of imports or exports sourced from, or destined for, the selected economy.
Tiles are shaded in different intensities according to the value of the share in the particular product category. The higher the share of the economy in a particular category, the darker the colour. Users can also hover over the tiles to see the exact values of trade flows and other relevant information.
The Trade Connectivity Heatmap allows users to explore and visualize data for four indicators:
- Imports originating from the selected economy, as a share of other economies' total imports in the chosen product category.
- Exports destined for the selected economy, as a share of other economies' total exports in the chosen product category.
- The selected economy's imports originating from other economies, as a share of the selected economy's imports in the chosen product category.
- The selected economy's exports destined for other economies, as a share of the selected economy's exports in the chosen product category.
The indicators allow users to explore different types of relationships. For example, indicator 1 allows users to see which economies import most of their products from the selected economy, while indicator 3 shows the opposite — economies and products from which the selected economy is importing the most.
The same parallel can be drawn between indicators 2 and 4: indicator 2 shows which economies export most of their products to the selected economy, while indicator 4 shows to which economies the selected economy is exporting most of its products.
The Trade Connectivity Heatmap allows users to perform quick exploratory analysis in order to identify trade patterns that can later be explored in a more detailed manner. The chart can be shared and downloaded via the buttons at the bottom of the chart. The underlying data can be downloaded here.
Share
Share
Problems viewing this page? If so, please contact [email protected] giving details of the operating system and web browser you are using.