INTERNATIONAL TRADE STATISTICS
More
The WTO Stats Dashboard allows users to filter and change displayed information. Depending on the graph, data can be explored by reporting economy, trade flow, period (annual, quarterly, monthly), trade category, and product or sector breakdown.
Data sets available on the WTO Stats Portal are presented visually in the new tool via three distinct dashboards. The Merchandise Trade Dashboard provides a global overview of merchandise trade values via a global map, as well as regional breakdown and trends over time that can be explored by reporting economy and time period. This dashboard also presents merchandise trade indices in graphical form.
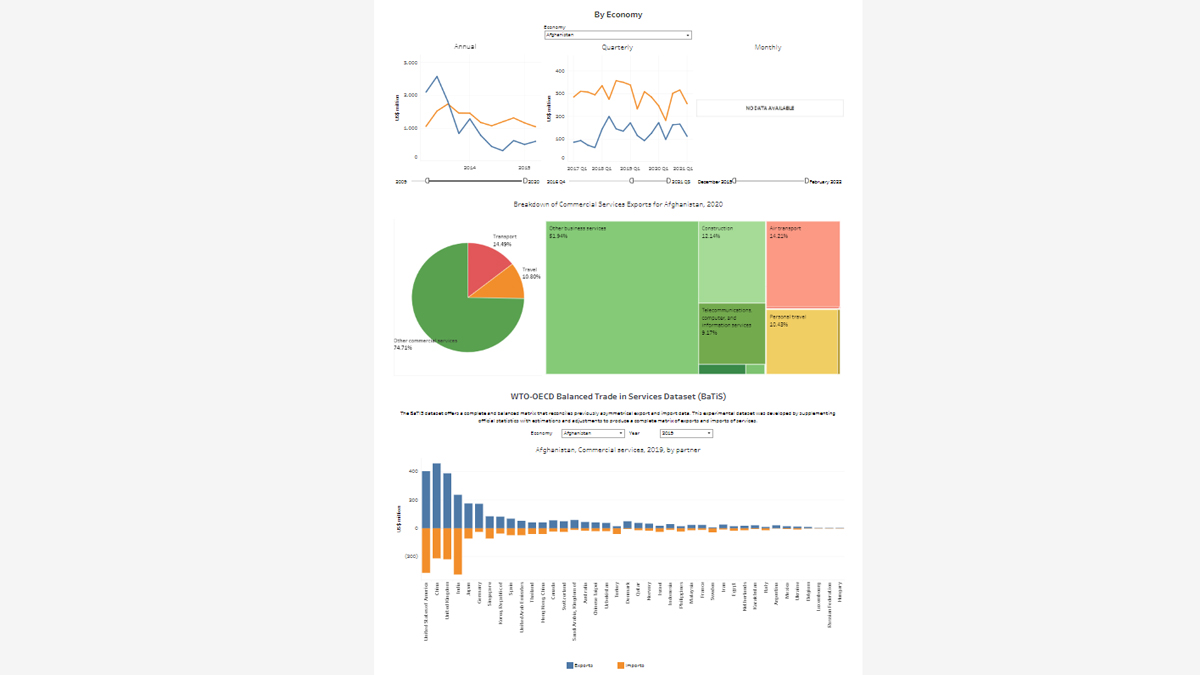
The Commercial Services Trade Dashboard presents published data on trade in commercial services by sector. Information on values and shares is presented with easy-to-follow colour coding. This dashboard also visualises the WTO-OECD Balanced Trade in Services (BaTiS) dataset, which uses both official statistics and estimates for missing data to provide a complete and balanced matrix; data is presented for trade in commercial services by partner.
The Market Access Dashboard allows users to quickly check the latest MFN tariffs applied by WTO members and legal maximum tariffs (bound tariffs and binding coverage) for various economies. The statistics are presented by agriculture/non-agriculture sectors and by various product groups.
The WTO Stats Dashboard can be accessed here as well as through the WTO Stats Portal. French and Spanish versions of the WTO Stats Dashboard will be published in mid-April.
Share
Share
Problems viewing this page? If so, please contact [email protected] giving details of the operating system and web browser you are using.