
WTO: 2013 PRESS RELEASES
PRESS/694
PRESS RELEASE
MORE:
> 2013 press releases
World trade growth in 2013 and 2014 is likely to be slower than previously forecast. WTO economists now predict 2013 growth of 2.5% (down from the 3.3% forecast in April), and 4.5% in 2014 (down from 5.0%), but they say conditions for improved trade are gradually falling into place.
MAIN POINTS
- World merchandise trade is set to grow 2.5% in 2013, very close to the 2.3% rate seen in 2012.
- Trade growth should accelerate to 4.5% in 2014, still below the average rate of 5.4% for the last 20 years (1982-2012).
- Imports of the EU from the rest of the world fell 2% in the first half of 2013 compared to the same period in 2012, hitting the exports of its trading partners.
- Imports of Developing economies and CIS have continued to grow strongly in 2013 (up 5% for the year to date), partly cushioning the drop in the EU and stagnation in the US.
- Risks to the forecast are more balanced than in the past, since world trade growth could be higher than forecast if the EU rebounds relatively quickly from its recession. The most conspicuous downside risk is the phasing out of unconventional monetary policy in the US.
The demand for imports in developing economies is reviving but at a slower rate than expected. This hindered the growth of exports from both developed and developing countries in the first half of 2013 and was the reason for the lower forecasts, they said.
(The April press release is here.)
“There is a message for the WTO in this,” said WTO Director General Roberto Azevêdo. “The past two years of sluggish trade growth reinforce the need to make progress in the multilateral negotiations.
“Although the trade slowdown was mostly caused by adverse macro‑economic shocks, there are strong indications that protectionism has also played a part and is now taking new forms which are harder to detect,” he went on. “Fortunately, there is something we can do about this. Negotiations under way in Geneva can address these problems, facilitating greater trade and opportunities to spur economic growth.
“I am encouraged at the level of commitment shown by WTO members. But much hard work remains in the coming weeks if we are to deliver a successful outcome at the ministerial conference in Bali,” he said.
Some short-term prospects are improving with encouraging data coming from Europe, the US, Japan and China. Reports on private sector activities from purchasing managers (purchasing managers’ indices, which give some indication about future activity), shipping rates, automobile production and other leading indicators, suggest that the economic slowdown has bottomed out and that a tentative recovery is underway. This is expected to be reflected in rising quarterly growth in the months ahead, WTO economists say.
The European sovereign debt crisis has eased significantly since last year, unemployment in the United States has fallen to 7.3% from a post-crisis high of 10%, and growth of GDP (gross domestic product, a measure of a country’s output) in Japan has accelerated since the adoption of new fiscal and monetary policies.
Although large developing economies have slowed appreciably in recent months, the latest figures from China on industrial production suggest that the country may be regaining some of its dynamism. On the other hand, India’s economy is still in the midst of a sharp contraction according to composite leading indicators calculated by the Organisation for Economic Cooperation and Development (OECD).
However, since the European Union consumes roughly one third of the world’s traded goods (including shipments between member countries within the EU) and the EU unemployment rate is likely to remain at or near record levels for some time, growth in trade can be expected to be below average — that is, below the 20-year average of 5.4% — in the coming quarters (Chart 1).
Chart 1 — World merchandise trade volume by level of development, 2010Q1-2013Q4a
Seasonally adjusted indices, 2005Q1=100
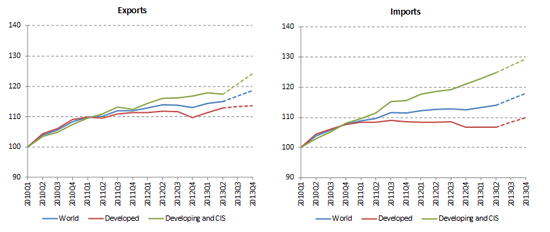
a Figures for 2013Q3 and 2013Q4 are projections.
Source: WTO Secretariat.
Chart 1 shows the quarterly evolution of merchandise trade by level of development since the first quarter of 2010, with data sourced from the WTO’s short-term trade statistics.
The volume of world merchandise trade (i.e., goods trade adjusted to account for changes in prices, exchange rates and seasonal variation) was only up 1.2% in the first half of 2013 compared to the same period in 2012. For the forecast of 2.5% growth in world trade to be realized would require a 3.8% year-on-year increase in the second half of 2013, which is feasible.
Some of the demand to fuel this growth would undoubtedly come from increased imports in developed economies. These dropped 1.6% in the first six months of 2013 and would require a 1.4% rise in the second half just to achieve 0% growth for the year. Whether this happens will depend mostly on the pace of recovery in the EU.
One of the few bright spots on the trade landscape since the European sovereign debt crisis flared in the middle of 2012 has been the resilience of developing economies’ imports, which have buoyed exports from other countries. These were up 5.8% year-on-year in the first half of 2013, but this is expected to moderate to around 5.5% in the second half of the year.
The fact that imports of developing economies have risen roughly 12% in the last two years while those of developed economies have been flat or declining suggests that developing economies have partly cushioned the drop in developed economy imports. (For the purposes of this analysis, “developing economies” include the Commonwealth of Independent States.)
Table 1 summarizes the annual trade forecasts for 2013 and 2014, including consensus estimates of real GDP at market exchange rates. The WTO currently expects the volume of world merchandise trade to grow 2.5% in 2013. On the export side, it expects a 1.5% increase for developed economies and a 3.6% rise for developing economies.
Table 1: World merchandise trade and GDP, 2009-2014 a
Annual % change

a Figures for 2013 and 2014 are projections.
b Average of exports and imports.
Source: WTO Secretariat for trade, consensus estimates of economic forecasters for GDP.
On the import side, the WTO is forecasting stagnant growth of –0.1% for developed countries and a more robust 5.8% increase for developing economies.
In 2014, world trade is expected to advance 4.5%, with exports of developed economies climbing 2.8% and those of developing countries increasing 6.3%. Imports of developed economies are projected to grow 3.2% in 2014 while those of developing economies should expand by 6.2%.
The revised trade forecasts are accompanied by a slight downward revision in the GDP estimates compared to the April release (from 2.1% to 2.0% in 2013, and from 2.7% to 2.6% in 2014). GDP figures refer to output at market exchange rates and are generally smaller than the equivalent figures measured at purchasing power parity (PPP).
The weakness of developed economy imports in 2012 and 2013 can mostly be attributed to the prolonged recession in the euro area, which began in the fourth quarter of 2011 and stretched into the first quarter of this year. GDP growth for the EU (including countries that do not use the euro) was only slightly more positive, with just a single quarter of rising output over the same period according to OECD Quarterly National Accounts statistics. The recession compressed incomes and reduced demand for all goods, including imports, in the world’s largest single market.
The influence of the EU recession on trade can be seen in Chart 2, which shows seasonally adjusted quarterly merchandise trade volume indices for the period “2010Q1”–“2013Q2” (i.e., first quarter of 2010 to second quarter of 2013) for the EU, the US, Japan and Developing Asia (defined as the sum of all Asian economies excluding Japan, Australia and New Zealand.)
Exports of the EU to the rest of the world (i.e., extra-EU exports) have continued to grow strongly in recent quarters, rising 5.6% in the first half of 2013 and 30% since 2010Q1.
Chart 2 : Merchandise exports and imports of selected economies, 2010Q1-2013Q2Seasonally adjusted volume indices, 2010Q1=100
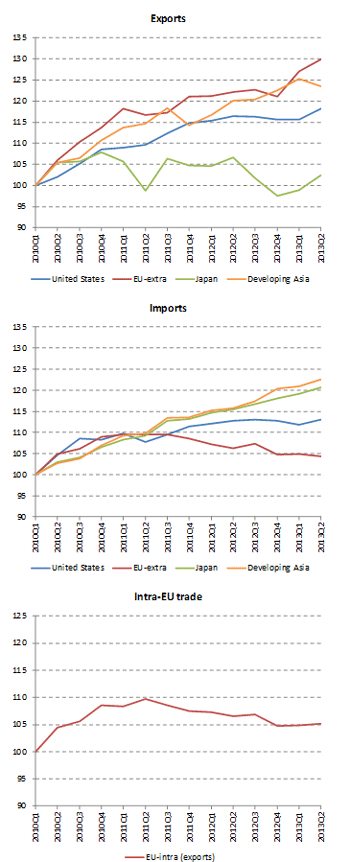
Source: WTO Secretariat.
However, both extra-EU imports and trade between EU countries (i.e., intra-EU exports) have declined steadily since the middle of 2011, dropping around 2% year-on-year in the first half of 2013. Since the EU (including intra-EU trade) accounts for fully 33% of world imports and 58% of developed economy imports, economic shocks there will be strongly reflected in world aggregates.
US exports and imports have been flat since the beginning of 2012, held down by weak external demand and slow growth at home. However, in the second quarter of this year, exports jumped 2.2% compared to the previous quarter (9% when calculated as an annual rate), while imports advanced 1.0% (4% annualized), possibly indicating a turning point for US trade flows.
The other notably weak performance in Chart 2 is Japan’s on the export side. The sharp dip in exports in 2011 is linked to the earthquake and tsunami that devastated Japan in that year. The more recent slump beginning in 2012Q3 appears to be related to a diplomatic dispute between Japan and China that has soured trade relations between the two countries. By the second quarter of 2013, Japanese exports were little changed since the beginning of 2010, but imports rose around 20% over the same interval. Japan’s export performance may be erratic, but since it only makes up 4% of world exports and 9% of developed economy exports it has less of a direct influence on broad aggregates.
Trade flows of developing Asia (which includes China) have maintained a steady pace of growth in recent years, but exports dipped 1.4% in the second quarter of 2013 compared to the first quarter (5.4% annualized). This was due to a relatively sharp drop in China’s exports, which could partly be related to weak demand in China’s trading partners, but could also reflect recent Chinese efforts to correct for misreporting of trade values. However, since trade data are not revised for earlier years, it is unclear whether the drop in the second quarter represents and actual decline in trade flows.
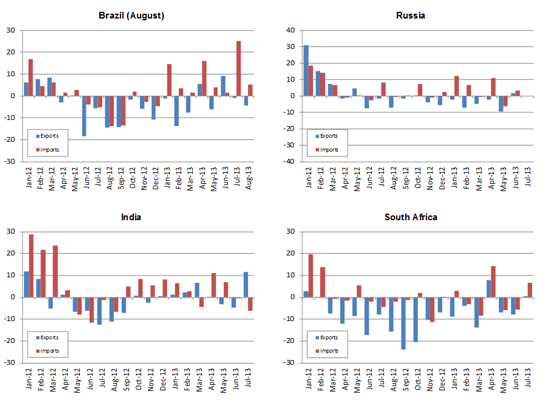
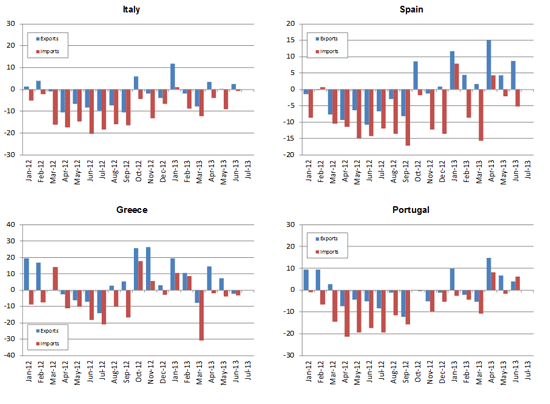
Finally, Chart 3 shows year-over-year growth in merchandise trade for a wide selection of countries in current US dollar terms. These data are available through June, July or August, depending on data availability. As such, they can provide an earlier indication of trade developments in the third quarter compared to volume indices, which are generally less timely. It is worth noting that Germany’s exports and imports recorded solid increases in June and July, which could presage a turnaround in EU-wide trade flows.
For more detailed monthly and quarterly trade statistics: www.wto.org/statistics
Chart 3 — Merchandise exports and imports of selected economies, October 2011-July 2013 Year-on-year % change in current dollar values


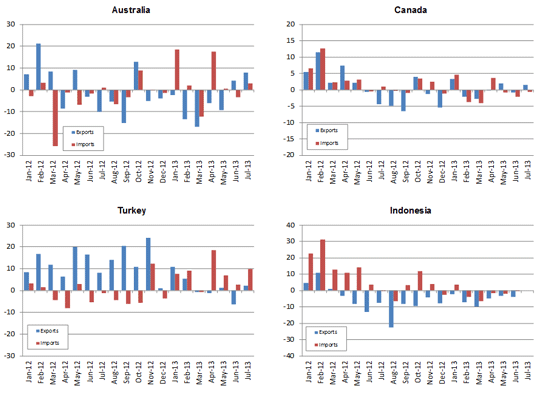
Sources: IMF International Financial Statistics, Global Trade Information Services GTA database, national statistics.
> Download this press release (pdf format, 8 pages, 124KB)
> Problems viewing this page?
Please contact [email protected] giving details of the operating system and web browser you are using.