agricultura
Gráficos - Comercio mundial de productos agropecuarios
Los gráficos que figuran a continuación muestran cifras y tendencias fundamentales del comercio de productos agropecuarios definidos en el Acuerdo sobre la Agricultura de la OMC (1)- desglosadas por regiones, países/territorios y categorías amplias de productos. Las cifras son estimaciones de la OMC (según datos comunicados por la base de datos UN Comtrade, complementados con corrientes de datos simétricas de las economías que no proporcionan información). Las cifras correspondientes al mundo y Europa no incluyen el comercio entre los miembros de la UE.
World trade of agricultural products, by geographical regions and broad categories of products (Billion US dollars)
Select the period covered by the chart with the "year range" selection. Select the category of products in the filter (all products, horticulture, primary bulk products, processed products, semi-processed products). It is also possible to customize the regions covered by clicking on the corresponding name to remove/add it on the chart. Chart pies with regional breakdowns appear when clicking on the corresponding dot in the chart.
Year range
From:
To:
Filter by category of products
The HS codes corresponding to these categories are available on the definitions tab of this Excel sheetWorld trade of agricultural products (Billion US dollars)
Select the flow (imports/exports) and the year on the world map below by using the corresponding scroll-down menu filters or by clicking on the corresponding dot in the summary chart on world trade. Individual economy-level data appear on the map when pointing on the corresponding country/economy.
Filter by type:
Filter by year:
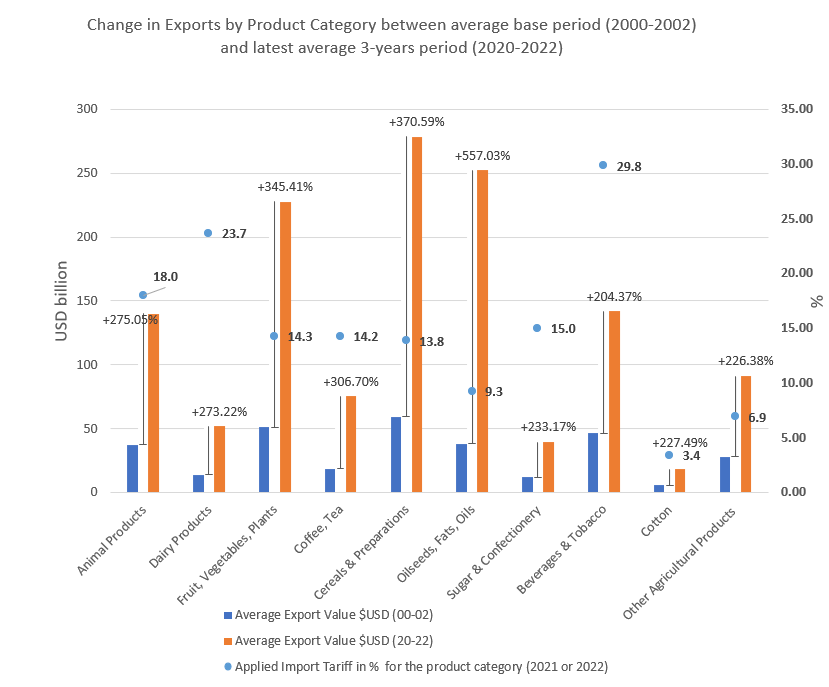
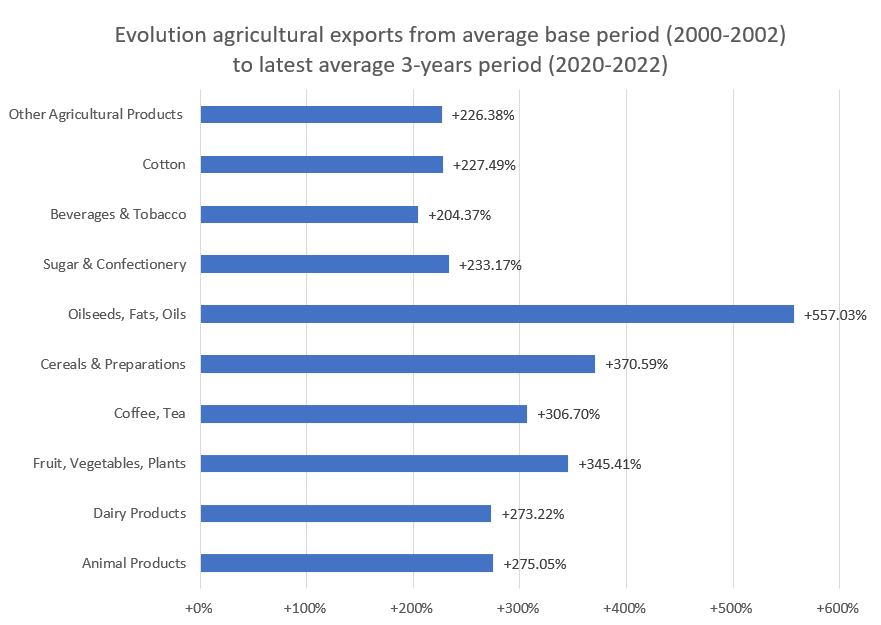
World exports of agricultural products, by groups of products (Billion US dollars)(2)
Filter by groups of products
Footnotes
- This definition is different from the one used elsewhere (like the World Trade Statistical Review, the stats.wto.org-database and the dashboard presentation under "merchandise trade") that is based on SITC definitions and includes (inter-alia) also fishery and forestry products. Back to text
- The definition of groups of products and the average tariff estimate by group of products used in this chart come from the World Tariff Profiles report. The trade data are sourced from the WTO Analytical Database. Back to text