ECONOMIC RESEARCH AND ANALYSIS
More
Note: South America includes Central America and the Caribbean. The CIS refers to the Commonwealth of Independent States, including certain associate and former member states.
Source: WTO and UNCTAD.
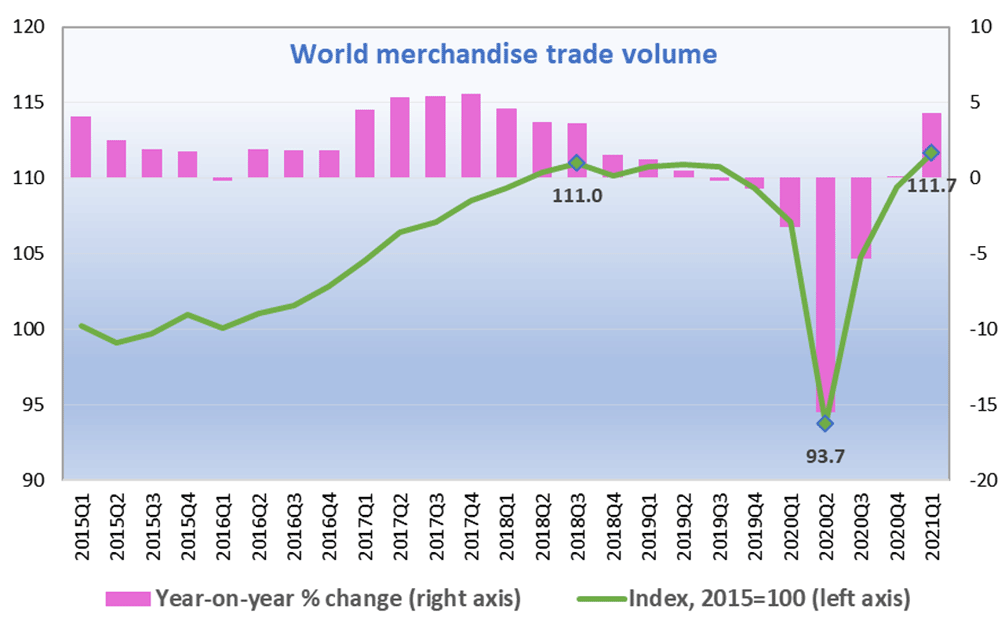
The volume of world merchandise trade grew 2.1% quarter-on-quarter in Q1, which is equivalent to an annual rate of 8.7%. Year-on-year growth picked up to 4.3% in the same period. A bigger increase is expected in the second quarter due to the steep decline in the same quarter a year ago. The current pace of recovery is broadly consistent with the WTO's most recent forecast of 31 March 2021, which predicted global merchandise trade growth of 8.0% in 2021 and 4.0% in 2022. Inequitable access to COVID-19 vaccines continues to pose the greatest threat to the economic outlook since a failure to protect all people regardless of income leaves populations vulnerable to further waves of infection. The next forecast update will be released in October.
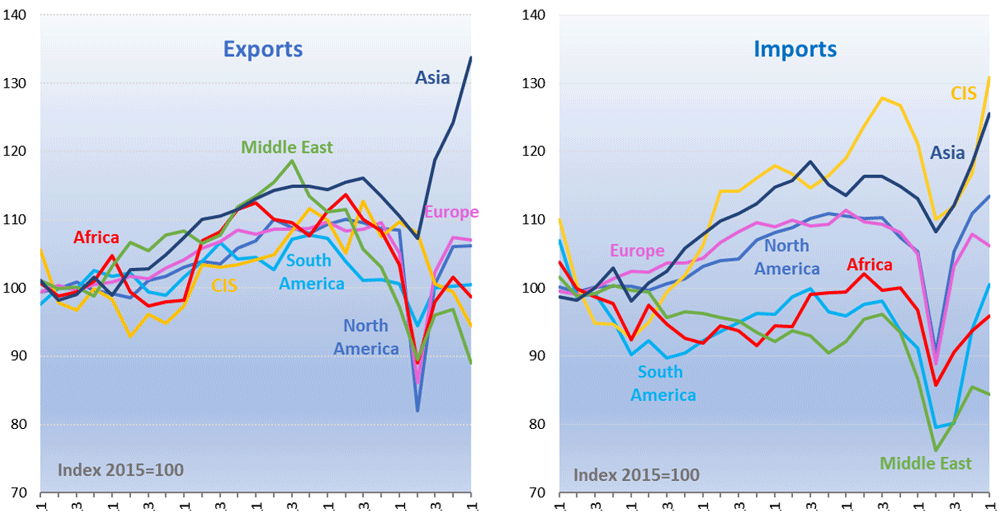
Most regions have seen merchandise exports and imports recover to varying degrees since trade bottomed out in the second quarter of last year. The major exception is the Commonwealth of Independent States (CIS) including certain former and associate members, exports of which have continued to decline. In the first quarter of 2021, merchandise export volumes were up in Asia (+21.0% year-on-year) and Europe (+1.9%). They were down slightly in South and Central America (‑0.1%) and North America (‑2.2%), and down more substantially in Africa (‑4.6%), the Middle East (‑8.4%) and the CIS (‑13.9%).
By comparison, merchandise import volumes were up year-on-year in all regions except Africa (‑0.9%) and the Middle East (‑2.7%). Overall, it appears that the trade recovery to date has been strongest in Asia and weakest in regions that export natural resources disproportionately.
Merchandise trade values
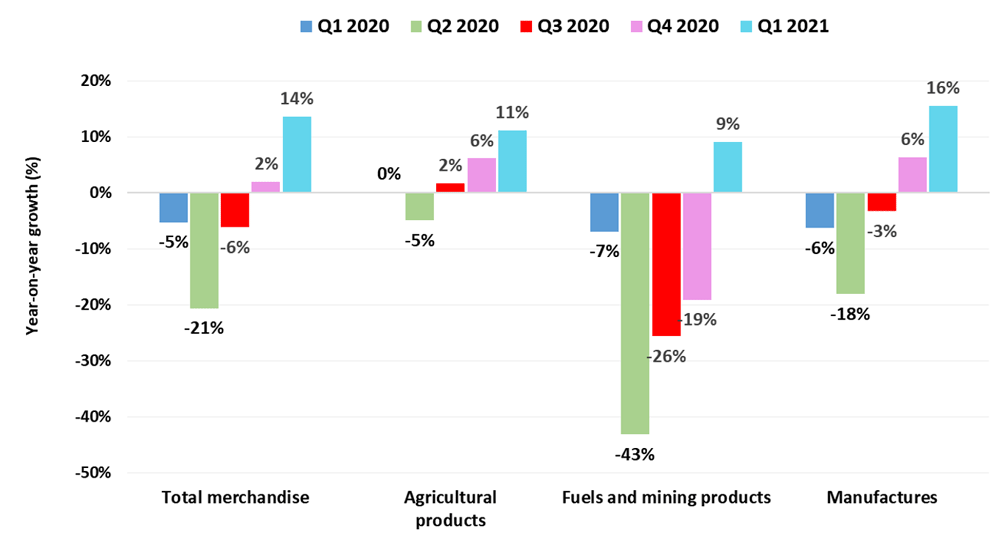
Merchandise trade in nominal US dollar terms also rebounded strongly in the first quarter, up 14% year-on-year, due to a combination of increased quantities and higher prices. The sharp decline and subsequent rebound since the start of 2020 mostly reflects trends in manufactured goods trade, while other product categories made smaller contributions. Prices of primary commodities fell during the first wave of the pandemic but have since risen steadily, contributing to the upswings in fuels, mining products and agricultural products trade. In May 2021, prices were up 194% year-on-year for fuels, 54% for metals, 45% for food and 26% for agricultural raw materials according to IMF primary commodity price statistics.
Source: WTO estimates.
WTO estimates for the first quarter of 2021 show strong year-on-year growth in all main product categories of merchandise trade. Manufactured goods trade was up 16% in the first quarter after having fallen 18% in the second quarter of 2020 at the height of the pandemic. Trade in agricultural products was up 11% in the latest quarter while shipments of fuels and mining products rose 9%.
Source: WTO estimates.
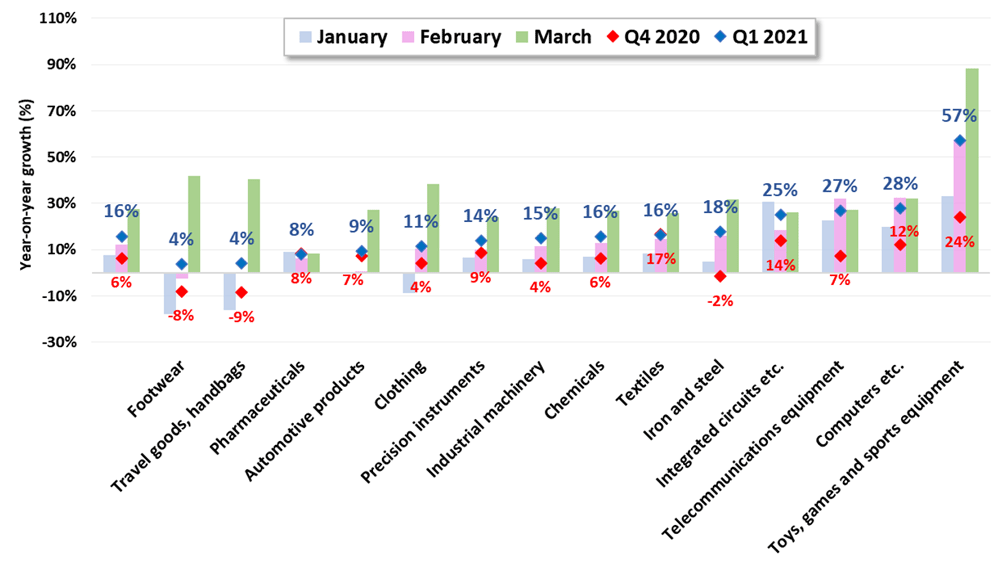
Sub-sectors of manufactured goods showed positive year-on-year export growth in the first quarter (see chart above). Computers, telecommunications equipment, and integrated circuits all recorded robust year-on-year trade growth of between 25% and 28% in the latest quarter. In contrast, personal items such as footwear, handbags and clothing saw more modest increases of between 4% and 11% (see above). Growth in exports of pharmaceuticals moderated to 8% in the first quarter after having spiked last year.
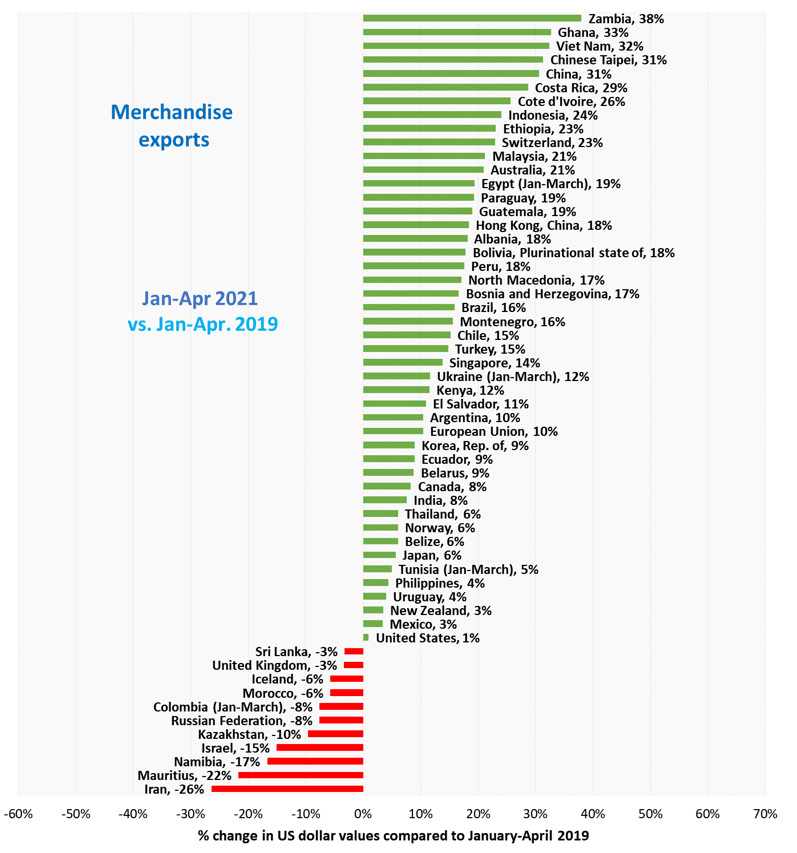
Despite the strong recovery of merchandise trade values in the first quarter of 2021, exports of many economies remain below their pre-pandemic peaks. This is illustrated by the following chart showing growth in the cumulative US dollar value of exports from January to April 2021 compared to the same period in 2019 for selected economies. Exports of the United States only increased by 1% over this period while those of the European Union rose 10%. Exports of the Russian Federation remained below their level of two years ago (-8%) while those of China were up sharply (+31%). Some countries such as Zambia (+38%) benefitted from improved terms of trade over this period as metals prices rose nearly 50% since 2019, whereas others such as Namibia (-17%) did not.
Source: National data, Eurostat, and Trade Data Monitor (TDM).
The latest trade statistics are presented here. More of the short-term trade statistics are available in the WTO Data Portal. As the data are subject to frequent revisions, the statistics cited above are estimates as of time of publication.
Share
Share
Problems viewing this page? If so, please contact [email protected] giving details of the operating system and web browser you are using.