
WTO: 2010 PRESS RELEASES
PRESS/614
PRESS RELEASE
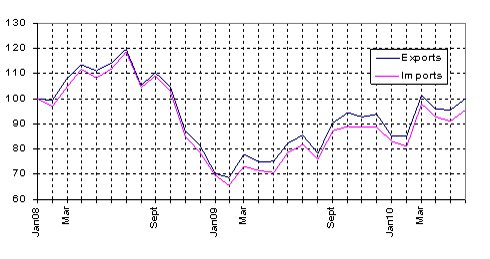
World merchandise exports increased by about 7% in the second quarter of 2010, in comparison with the first quarter (“quarter on quarter”) 1. Within that period, available monthly statistics for about 70 economies representing about 90% of world trade show that merchandise trade declined in April and May 2010, then rose again in June.
Chart 1: World merchandise exports, first quarter 2007 to
second quarter 2010
Indices, first quarter 2005=100

Chart 2: Monthly merchandise trade, aggregate of 70 economies
Indices, January 2008=100
Overview of regional trade flows
Asian exports and imports both rose by more
than 35% in the second quarter of 2010, as compared to the
corresponding period of 2009. Exports from Africa and the Middle East
were 35% higher than in the corresponding period of 2009, fuelled by
demand in Asia and the US, and higher commodity prices.
The Commonwealth of Independent States (former members of the Soviet
Union) posted a buoyant 44% export growth. Similarly, extra-EU trade
(external trade between the EU and the rest of the world) was more
dynamic than trade within the EU.
Table 1: World merchandise trade by region and selected economies,
Apr-Jun, 2010
Percentage change in current US dollars, year-on-year and quarter-on-quarter
Exports |
|
Imports |
||
Y-o-Y |
Q-o-Q |
|
Y-o-Y |
Q-o-Q |
26 |
7 |
World (a) |
25 |
6 |
28 |
7 |
North America |
32 |
12 |
25 |
6 |
United States |
32 |
12 |
32 |
7 |
Canada |
30 |
10 |
24 |
16 |
South and Central America |
36 |
13 |
29 |
27 |
Brazil |
56 |
12 |
13 |
0 |
Europe |
15 |
0 |
13 |
0 |
European Union (27) (b) |
14 |
0 |
11 |
-2 |
intra EU |
11 |
-2 |
17 |
5 |
extra EU |
21 |
3 |
44 |
10 |
Commonwealth of Independent States (CIS) |
27 |
26 |
43 |
6 |
Russian Federation |
33 |
28 |
35 |
1 |
Africa and the Middle East |
10 |
1 |
37 |
15 |
Asia (a) |
38 |
10 |
41 |
23 |
China |
44 |
15 |
32 |
-1 |
India |
33 |
3 |
41 |
5 |
Japan |
35 |
5 |
37 |
12 |
Six East Asian traders (c) |
43 |
9 |
a Includes significant re-exports or imports for re-exports.
b “Intra EU” is trade within the EU; “extra EU” is trade between the EU and non-EU economies.
c Hong Kong, China (excluding re-export trade), Republic of Korea, Malaysia, Singapore, Taipei, Chinese, and Thailand.
Chart 3: Commodity price developments, second quarter 2010
Percentage change
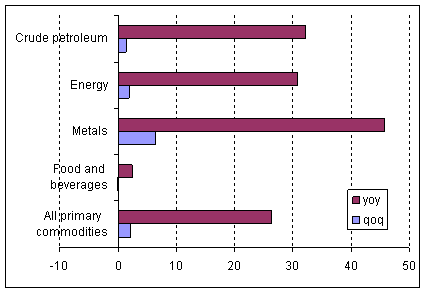
Source: IMF
More data are available on the WTO website’s “short-term merchandise trade statistics” page: The previous release is here.
1. WTO short-term merchandise trade values are not seasonally adjusted. Seasonal patterns therefore considerably affect the quarter on quarter (Q-o-Q) and month on month (M-o-M) developments in world trade, and this in turn affects comparisons between the trade developments in individual regions and economies.
Furthermore, these data refer to “current” US dollars, i.e., they are not adjusted for changes in prices. Therefore, they cannot be compared with the annual trade growth figures headlined in the 26 March 2010 press release. Those headline figures use “constant” dollars, with inflation taken into account. back to text
> Problems viewing this page?
Please contact [email protected] giving details of the operating system and web browser you are using.