Following faster than expected recovery in global trade flows so far in 2010,
WTO economists have revised their projection for world trade growth in 2010
upwards to 13.5%. The WTO's March forecast was a 10% expansion in trade volumes.
Merchandise exports of developed economies are predicted to expand by 11.5% in
volume terms while the rest of the world (including developing economies and the
Commonwealth of Independent States) is expected to see an increase of 16.5% for
the year (Table 1).
Table 1: Merchandise exports and GDP by region, 2007-2010 |
|||||
Annual % change |
|
|
|
|
|
|
|
2007 |
2008 |
2009 |
2010 a |
Volume of merchandise exports |
|
|
|
|
|
|
World |
6.5 |
2.2 |
-12.2 |
13.5 |
|
Developed economies |
4.8 |
0.8 |
-15.3 |
11.5 |
|
Developing economies and CIS |
9.0 |
3.8 |
-7.8 |
16.5 |
Real GDP at market exchange rates (2005) |
|
|
|
|
|
|
World |
3.8 |
1.6 |
-2.2 |
3.0 |
|
Developed economies |
2.6 |
0.4 |
-3.5 |
2.1 |
|
Developing economies and CIS |
8.0 |
5.7 |
2.0 |
5.9 |
a Projections |
|||||
This would be the fastest year-on-year expansion of trade ever recorded in a
data series going back to 1950. But such a large growth rate should be
understood in the context of a severely depressed level of trade in 2009, when
world exports plunged by 12.2%. The next fastest year-on-year growth was 11.8%
in 1976, one year after the then unprecedented decline of 7.3% in 1975.
“The strong recovery of trade signals improved economic activity worldwide,”
said WTO Director-General Pascal Lamy. “This surge in trade flows provides the
means to climb out of this painful economic recession and can help put people
back to work. It underscores, as well, the wisdom governments have shown in
rejecting protectionism.”
World merchandise trade rose sharply in the first two quarters of 2010, driven
by the recovery of GDP in both developed and developing economies (Chart 1).
Most economists expect output growth to slow in the second half as fiscal
stimulus measures expire and the inventory cycle winds down. This is likely to
restrain the growth of trade in the second half of 2010 compared to the first
half.
The global trade growth projection is consistent with the WTO Secretariat's
time-series model for import demand in a range of advanced economies, and
assumes a reduced rate of GDP growth for developed countries in the second half
of 2010 rather than an absolute decline.
Risks to the forecast are mostly on the downside, particularly if an unforeseen
financial or macroeconomic shock triggers another economic downturn. However,
some upside potential exists as well if growth is better than expected in the
2nd half of the year.
Chart 1: Monthly merchandise exports and imports of selected economies,
January 2006 — August 2010
(Billion dollars)
> Problems viewing this page?
Please contact [email protected] giving details of the operating system and web browser you are using.
United States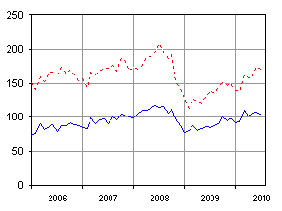 |
Japan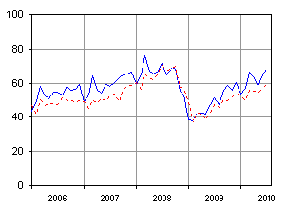 |
European Union (27) extra-trade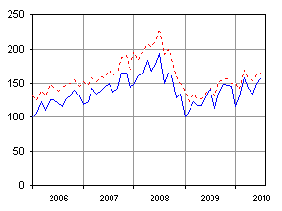 |
France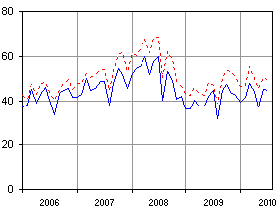 |
Germany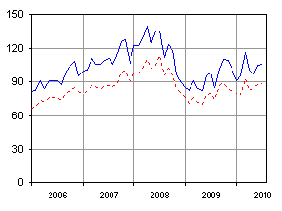 |
United Kingdom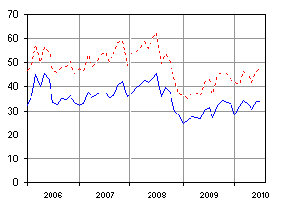 |
China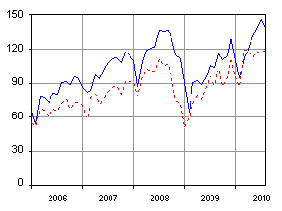 |
Republic of Korea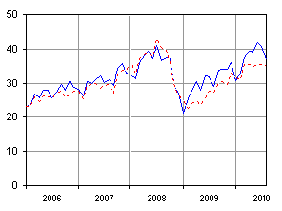 |
Brazil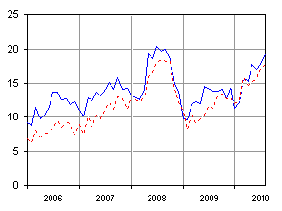 |
India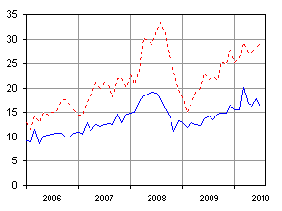 |
Russian Federation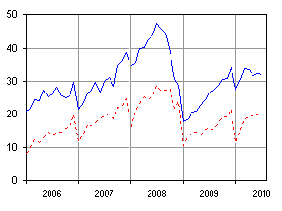 |
South Africa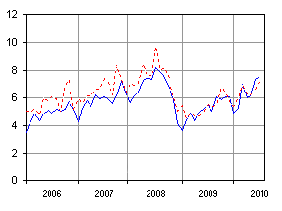 |
Chinese Taipei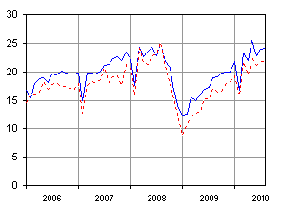 |
Singapore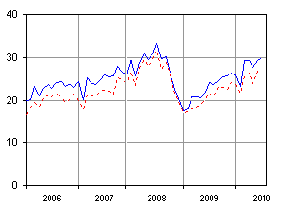 |
Malaysia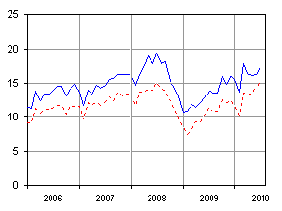 |
Thailand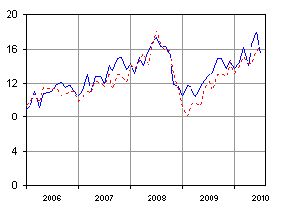 |
Turkey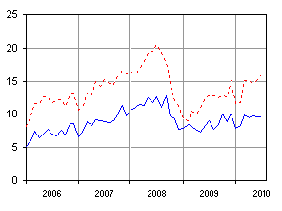 |
Mexico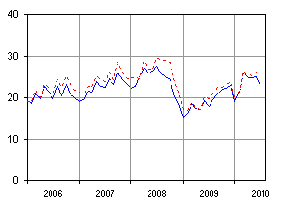 |
|
|
Sources: IMF International Financial Statisitics, Global Trade Information Services GTA database, national statistics.
