INTERNATIONAL TRADE STATISTICS
More
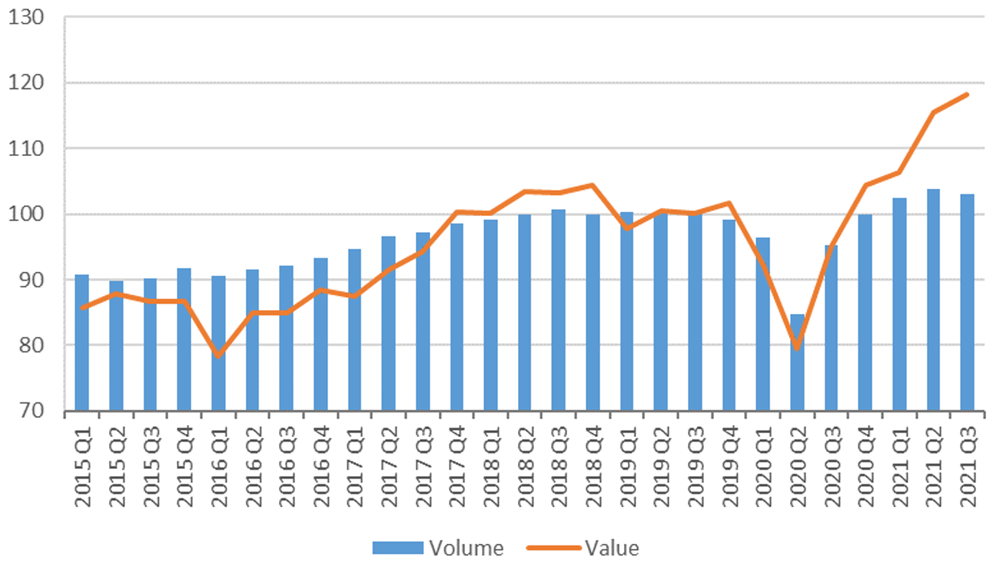
Despite strong headwinds contributing to the decline in the third quarter, trade volume was still up 11.9% for the year-to-date through September. This is slightly worse than the WTO's most recent trade forecast of 4 October, which anticipated a 12.7% rise over the same period. The forecast of a 10.8% increase in merchandise trade for the whole of 2021 could still be realized if fourth quarter data show a pickup in volume growth. This is a real possibility since measures to unblock container ports on the west coast of the United States have met with some success. Also, even though the WTO's Goods Trade Barometer has signalled a cooling of trade growth in the closing months of 2021, it still remains on trend. Nevertheless, the emergence of the Omicron variant of SARS-CoV-2appears to have tipped the balance of risks towards the downside, increasing the chance of a more negative outcome (Chart 1).
Chart 1: World merchandise trade volume and value, 2015Q1 - 2021Q3
(Index, 2019 = 100)
Source: WTO and UNCTAD.
Note: World trade refers to average of world exports and imports.
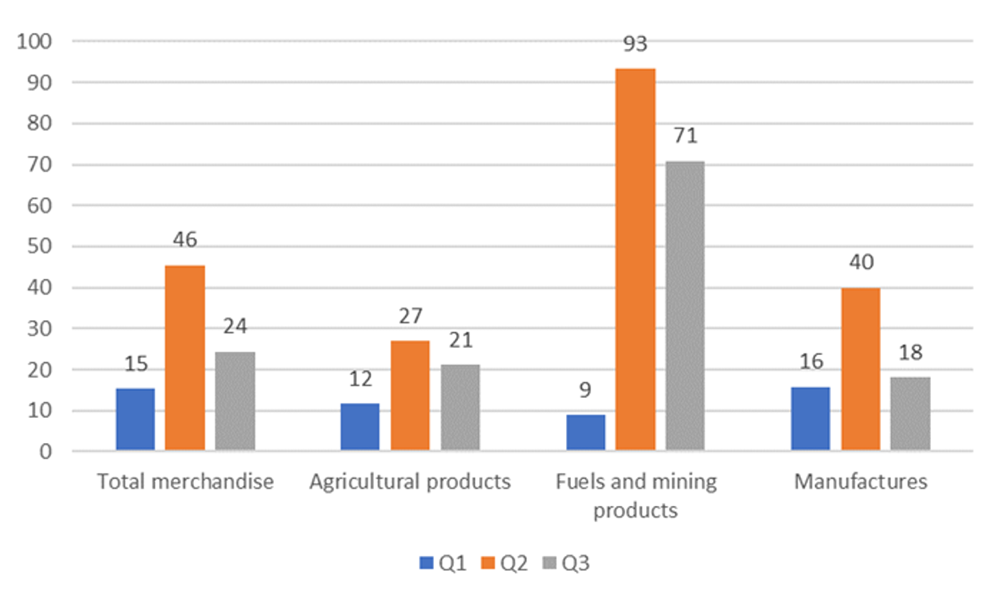
In contrast to volume, the value of world merchandise trade continued to climb in the third quarter as export and import prices rose sharply. World trade as measured by the average of exports and imports was up 24% year-on-year in the third quarter in nominal U.S. dollar terms. This growth is weaker than the 46% jump in the second quarter but stronger than the 15% increase in the first quarter. Trade values were boosted by primary commodities including fuels, prices of which more than doubled between the third quarter of 2020 and the third quarter of 2021. According to IMF statistics, Fuel prices dipped in November after peaking in October, but they were still up 137% year-on-year. Meanwhile, food prices were up 23% and base metals were up 13% over the previous year. Prices of many manufactured goods have also risen, pushing up measured inflation in many economies.
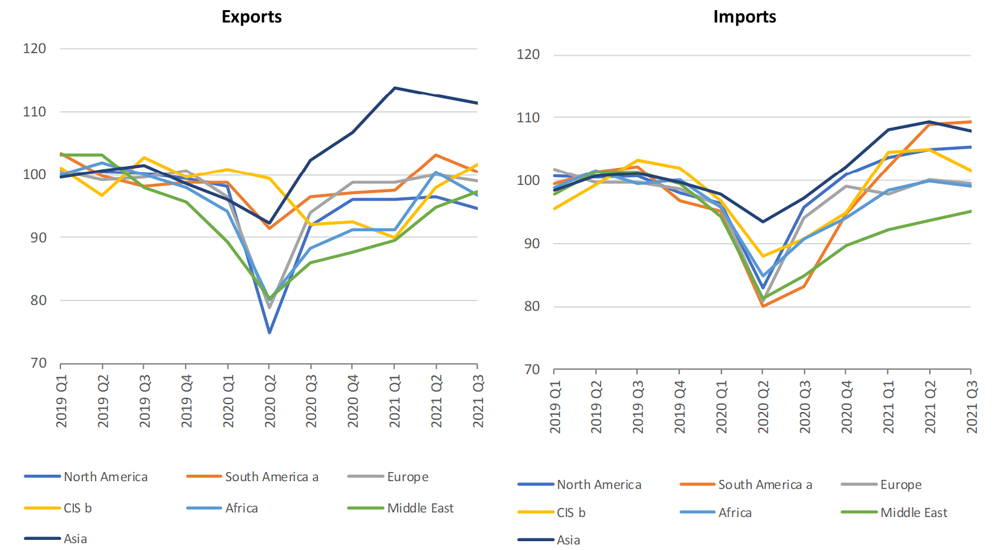
The main reason for the dip in merchandise trade volume in the third quarter was weaker than forecasted imports in North America and Europe. This translated into reduced exports from those regions and also from Asia (Chart 2). Asian imports contracted in the third quarter, but this decline was anticipated in the October trade forecast.
Seasonally-adjusted exports were down quarter-on-quarter in the third quarter in North America (‑1.9%), South and Central America (‑2.5%), Europe (‑1.0%), Africa (‑3.8%) and Asia (‑1.2). Exports were up in the Commonwealth of Independent States (CIS) including certain former and associate members (3.8%) and in the Middle East (2.6%).
Imports declined by 0.5% in Europe in the third quarter, even though they had been expected to grow 2.6%. Imports also fell in the third quarter in the CIS (‑3.2%), Africa (‑0.7%), and Asia (-1.3%). North America's imports were up 0.4% in the third quarter, but a stronger increase of 1.5% had been anticipated. Meanwhile, shipments from South America and the Middle East were up 0.4% and 1.6%.
Chart 2: Merchandise trade volume by region, 2019Q1-2021Q3
(Index, 2019 = 100)
Source: WTO and UNCTAD estimates.
a Refers to South and Central America and the Caribbean.
b Refers to Commonwealth of Independent States, including certain associate and former member States.
Merchandise trade values
Chart 3 shows year-on-year growth in the U.S. dollar value of world merchandise trade broken down by broad product category. Changes in merchandise trade values mostly reflect manufactures as this category accounts for the bulk of the total, 71% in 2020. By comparison, agricultural products account for 10%, fuels and mining products make up 13%, and unspecified products represent the remaining 6%. Trade flows of manufacture goods and agricultural products were up a similar amount in the third quarter, 18% and 21% respectively compared to the previous year. Trade in fuels and mining products was up 71% over the same period, boosted by a four-fold rise in natural gas prices.
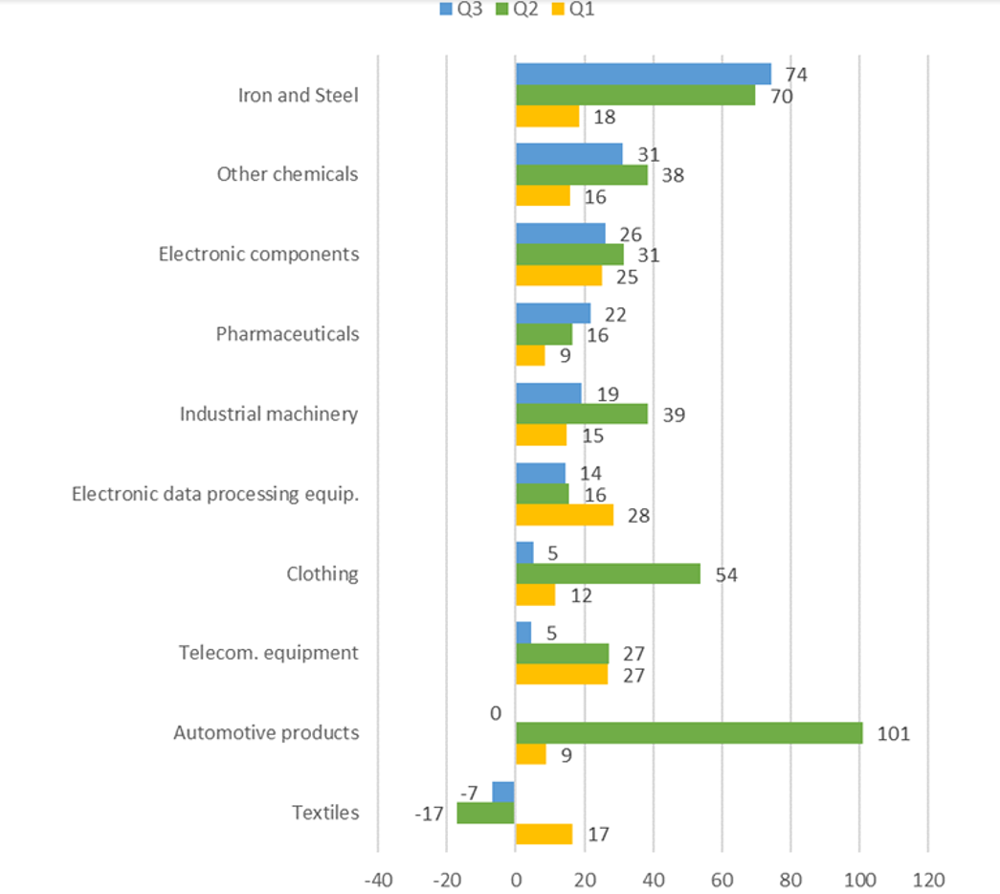
Chart 4 shows year-on-year growth in trade values for selected categories manufactured goods in the first three quarters of 2021. Some sectors showed strong increases in the third quarter, including iron and steel (73%), electronic components (26%), pharmaceuticals (22%), and other chemicals (31%). Others showed stagnation or decline, including automotive products (0%), telecommunications equipment (5%), clothing (5%) and textiles (-7%). Weakness in automotive products and telecommunications equipment reflects the recent shortage of semiconductors, which closed assembly lines for products that use of these inputs intensively. The category of textiles includes surgical masks, which surged earlier in the pandemic. The higher baseline for these products may explain their decline in the third quarter.
Chart 3: Year-on-year growth of merchandise trade, 2021Q1-2021Q3
(% change in US$ values)
Source: WTO estimates.
Chart 4: Year-on-year growth of manufactures, 2021Q1-2021Q3
(% change in US$ values)
Source: WTO estimates.
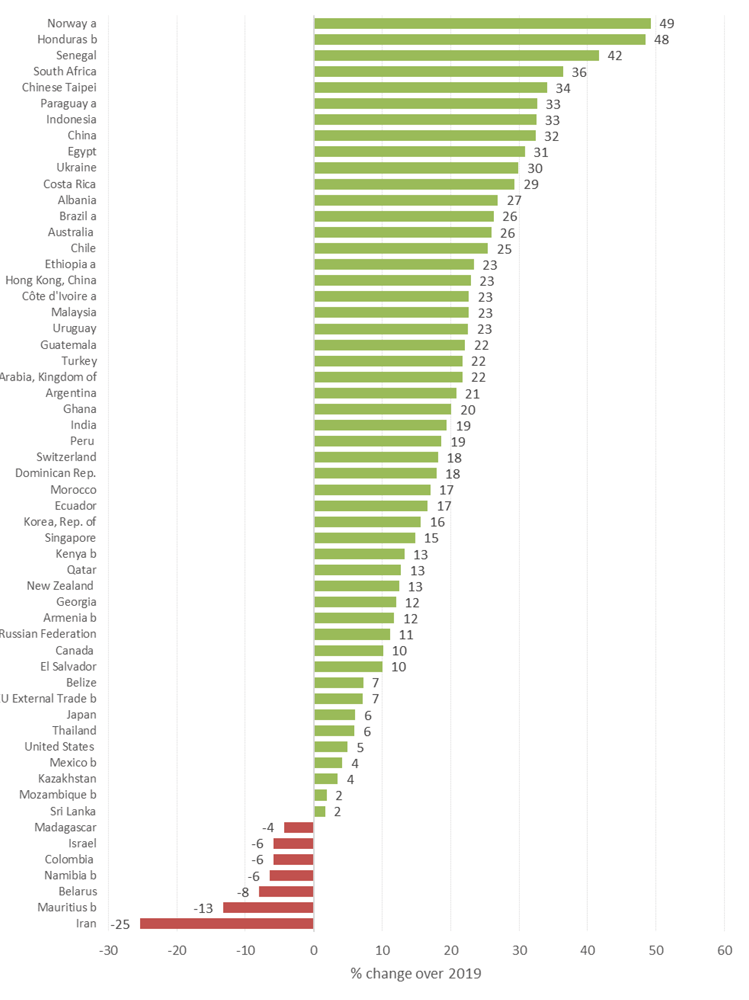
Finally, Chart 5 shows merchandise trade growth over two years for selected individual economies through the latest month available. Growth rates reflect a wide range of outcomes compared to the pre-pandemic period, with some countries (South Africa, China) recording increased export revenue while other have seen more modest increases (the United States, Mexico) or declines (Colombia, Namibia).
Monthly, Quarterly and Annual merchandise trade statistics in value and volume terms can be downloaded from the WTO's online database, here.
5: Merchandise export growth of selected economies, January-October 2021
(% change over same period in 2019)
January-November.
b January-September.
Source: National statistics accessed through Trade Data Monitor (TDM).
Additional indicators
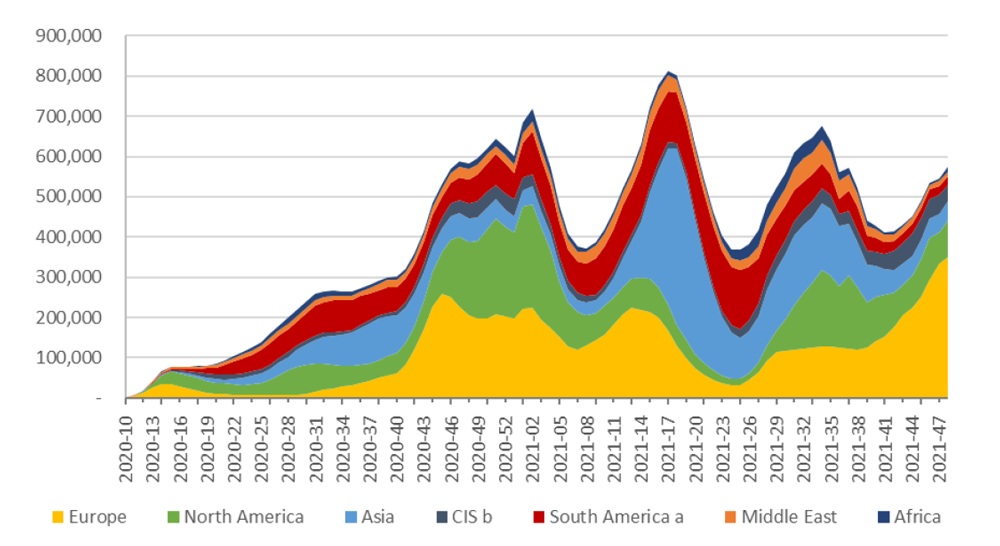
Charts 6, 7 and 8 point out some of the risks and challenges facing merchandise trade at the moment. Chart 6 shows waves of COVID-19 infection since the start of the pandemic by region. The third peak corresponds to the third quarter of 2021, when outbreaks disrupted activity at Chinese ports including Ningbo, the world's third busiest. COVID-19 cases bottomed out in October but have since started to rise again. This might cause further disruptions that could weigh on world trade in the fourth quarter and beyond. Europe, which represents more than 35% of world merchandise trade, has the highest case count of any region at present. Governments are commencing booster vaccinations to protect people against the highly contagious Omicron variant of COVID-19, which should blunt the impact of further spikes, both in terms of health and economic activity.
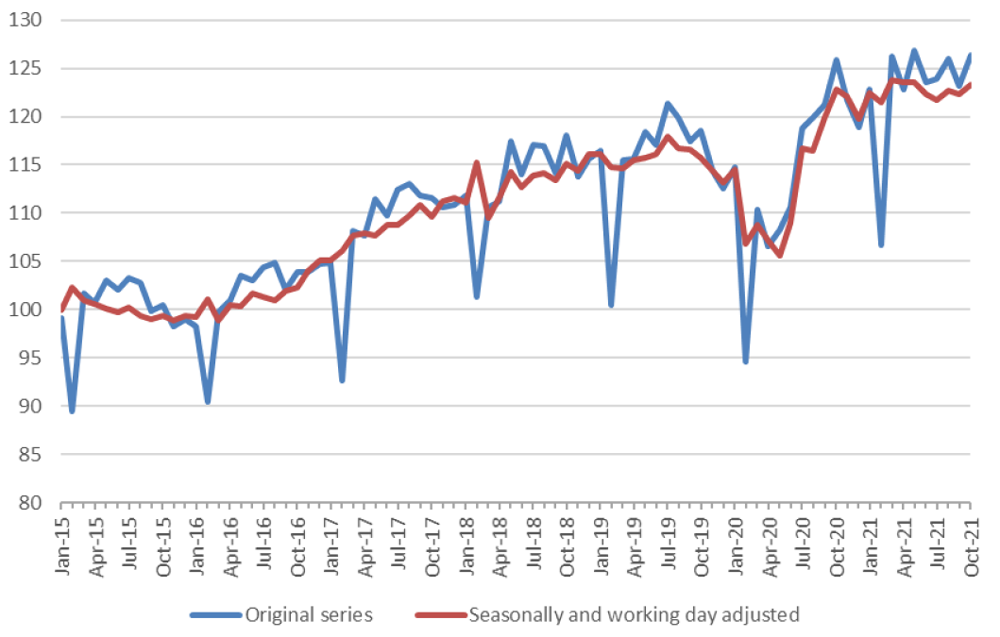
Chart 7 illustrates global container throughput based on an index covering 94 ports around the world. While throughput remains close to record levels, it has plateaued in recent months. Container handling in 2021 is up by around 9% year-to-date through October, which is comparable to merchandise trade volume growth over the same period. This indicator is worth monitoring for signs of an eventual pickup or downturn in trade.
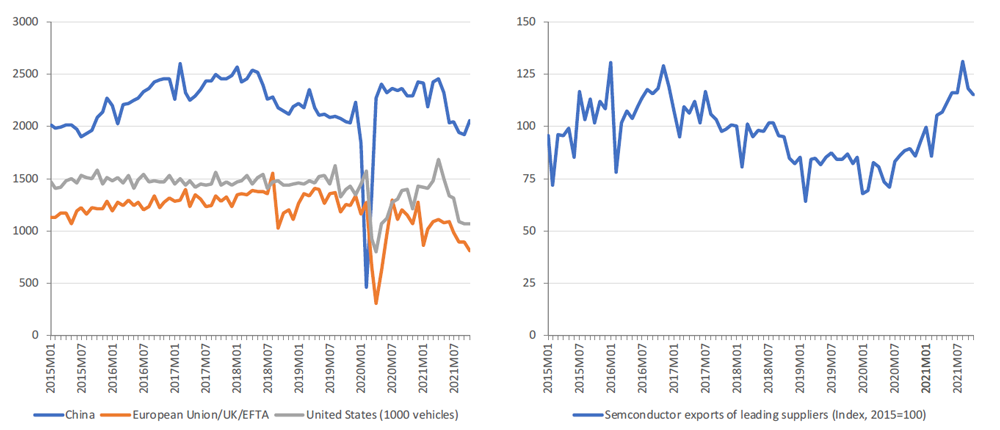
Finally, Chart 8 shows the impact of the semiconductor shortage on sales of highly traded automotive products. Vehicle sales continued to decline in October in the United States and the European Union (plus EFTA and the United Kingdom), but they have begun to turn around in China. Chinese car sales also appear to be up in November. Sales fell in these markets because car production failed to keep up with demand due to a lack of semiconductors. The second panel in Chart 7 shows the estimated volume of world trade in semiconductors, which has risen sharply through October. The rise in semiconductor trade may alleviate some of the production problems that have plagued the automotive sector and other industries in recent months.
Chart 6: Number of new COVID-19 cases per day since week 9 2020
(14-day moving average)
Source: WTO calculations based on ECDC data.
a Refers to South and Central America and the Caribbean.
b Refers to Commonwealth of Independent States, including certain associate and former member States.
Chart 7: RWI/ISL Container Throughput Index, January 2015-October 2021
(Index, 2015=100)
Source: Institute for Shipping Economics and Logistics.
Chart 8: Automobile sales in major markets and semiconductor exports of leading suppliers, January 2015 - October 2021
(1000 vehicles seasonally adjusted and index 2015=100)
Sources: China Association of Automobile Manufacturers (CAAM), European Automobile Manufacturers’ Association (ACEA), and U.S. Federal Reserve for car sales. National customs statistics accessed through Trade Data Monitor (TDM) for semiconductor exports.
Share
Share
Problems viewing this page? If so, please contact [email protected] giving details of the operating system and web browser you are using.