
HANDBOOK ON ACCESSION TO THE WTO: CHAPTER 5
Substance of Accession Negotiations
Click the + to open an item.
5.3 Negotiation of market access concessions and commitments
![]()
The negotiation of tariff concessions, commitments on agricultural support and export subsidies, and specific commitments on services take place either bilaterally or, in the case of commitments on agricultural support, in relatively small informal groups. This section focuses on the documentation on which these negotiations are based and the results of these negotiations.
Some active members of accession Working Parties have indicated that acceders should be prepared to undertake market access commitments that are commercially viable, or meaningful in trade terms. Some emphasize that these should be appropriate to the level of economic development of the applicant. It will be recalled that the Guidelines on the Accession of LDCs provide that in the area of market access, WTO Members are to exercise restraint in seeking concessions and commitments on trade in goods and services from acceding LDCs, taking into account the levels of concessions and commitments undertaken by existing WTO LDCs Members For their part, acceding LDCs are expected to offer reasonable market access concessions and commitments on goods and services commensurate with their individual development, financial and trade needs, in line with relevant WTO provisions on goods and services.444
Goods Schedule tariff concessions back to top
This section examines the format for initial offers, the way in which the results of the negotiations have been scheduled and the level of the tariff commitments undertaken by new Members.
Formats for Initial Offers and Scheduling of Tariff Concessions
The formats for initial offers and scheduling of tariff concessions, including notes on the way in which the format for scheduling has been used to reflect the results of negotiations, are at Annex 8.
Results of the negotiations all products
With very few exceptions all applicants that have acceded to the WTO have bound all of their tariffs in their Schedules. The great majority are ad valorem bindings. The average of the final bound ad valorem rates varies from 5.8 percent in the case of Chinese Taipei to 26.0 percent in the case of Nepal. The first four applicants to accede bound their tariffs at relatively high levels which may be regarded as unrepresentative of current practice. In the case of the applicants to have acceded since then, there appears to be no correlation between the average level of bindings and the date of their accession, their per capita income or the level of their applied duties at the time the negotiations took place.445 However, some points do emerge. The two LDCs, Cambodia and Nepal, are in a category of their own with average bindings of 19 percent and 26 percent respectively, in keeping with the Guidelines on LDC accession. Three developing countries, Tonga, Jordan and Oman, bound their tariffs at between 13.8 percent and 17.6 percent. All the other new Members bound the average of their ad valorem tariffs at between 5.8 percent and 12.7 percent.
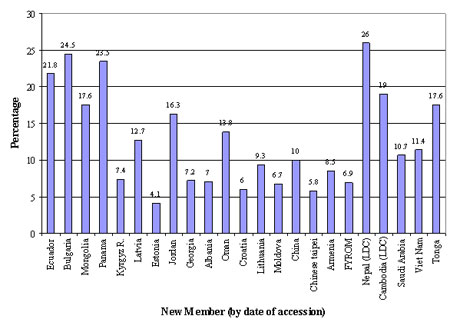
Source: WTO Trade Profiles
Results of the negotiations agricultural products
As a general rule WTO Members, including the recently acceded Members, have bound their tariff on all agricultural products.446
Table 4 presents the simple average of final ad valorem tariff bindings of agricultural products accepted by the new Members. This demonstrates that the results of the accession negotiations vary considerably, the average in this sector going from a low of 9.4447 to a high of 41.4 percent448. While no strikingly clear pattern emerges, this chart does show at least two things. First, that the Guidelines on the Accession of LDCs have had an effect and that less is asked of LDCs than of other acceders. Second, that, these apart, recent acceders have bound the average level of their tariffs at lower rates than countries that acceded in the earlier days of the WTO.
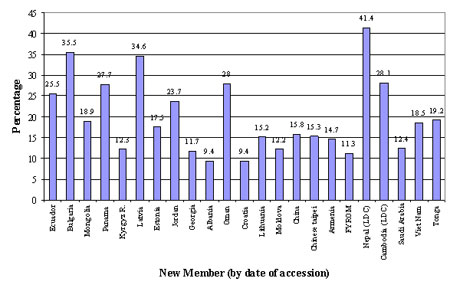
Table 5 analyses the results of the tariff negotiations on agricultural products for the new Members that have acceded to date in more detail. It shows that averages do not tell the whole story and that some have a much flatter tariff structure than others, as can be seen from the fact that among more recent acceders the highest final bound rate is 15 percent in one case and 500 percent in another. This exceptionally high binding was made by the acceder with the lowest average final binding of rates on all products.
Table 5 does not analyse specific and mixed duties, but does indicate the relatively small share of these duties in the Schedules of the new Members that have acceded to date. WTO Members tend to encourage acceders to use ad valorem duties as these are more transparent but they may agree to the binding of specific duties, especially if they export relatively high-priced goods on which the incidence of the duty is lower than on cheaper products covered by the same tariff heading.
Table 5 also shows that the simple averages of agricultural rates bound at accession are systematically higher than the averages of final bound rates, even though in some cases this difference is minimal. This indicates that acceders have negotiated transitional periods during which they phase in their final bound rates. The length of these periods varies up to ten years.
| Reduction commitments | Simple average of ad valorem tariff bindings (percent) | Distribution of ad valorem tariff bindings ( percent) | Share of non ad valorem tariff bindings (percent) | Min. ad valorem duty | Max. ad valorem duty | |||||||||
| 0 (duty-free) | 0.1-5.0 | 5.1-10.0 | 10.1-15.0 | 15.1-20.0 | 20.1-30.0 | 30.1-40.0 | 40.1-50.0 | 50.1+ | ||||||
|
Ecuador |
Bound rate at accession 1995 |
26.2 |
0.0 | 2.0 | 1.4 | 9.0 | 28.5 | 44.5 | 6.9 | 5.1 | 2.4 |
0.0 |
5.0 | 95.0 |
| Final bound rate 2001 |
25.5 |
0.0 | 2.0 | 1.4 | 9.0 | 28.2 | 45.1 | 7.4 | 4.5 | 2.3 |
0.0 |
5.0 | 85.5 | |
|
Bulgaria |
Bound rate at accession 1997 |
52.3 |
0.1 | 2.5 | 5.5 | 3.8 | 7.2 | 10.6 | 17.1 | 1.3 | 38.1 |
15.8 |
0.0 | 135.0 |
| Final bound rate 2005 |
35.5 |
5.0 | 6.6 | 9.3 | 10.3 | 2.4 | 13.1 | 9.9 | 0.9 | 28.6 |
15.8 |
0.0 | 98.0 | |
|
Mongolia |
Bound rate at accession 1996 |
19.0 |
0.7 | 0.7 | 0.7 | 23.2 | 72.4 | 0.6 | 1.0 | 0.3 | 0.3 |
0.0 |
0.0 | 75.0 |
| Final bound rate 2005 |
18.9 |
0.7 | 0.7 | 0.7 | 23.5 | 72.4 | 0.6 | 1.0 | 0.0 | 0.3 |
0.0 |
0.0 | 75.0 | |
|
Panama |
Bound rate at accession 1997 |
36.9 |
0.3 | 7.2 | 4.7 | 4.5 | 2.0 | 4.2 | 69.4 | 1.2 | 6.3 |
0.0 |
0.0 | 320.0 |
| Final bound rate 2007 |
27.7 |
0.3 | 7.2 | 4.8 | 5.1 | 6.0 | 70.0 | 1.1 | 0.8 | 4.5 |
0.0 |
0.0 | 260.0 | |
|
Kyrgyz Republic |
Bound rate at accession 1998 |
12.4 |
1.2 | 6.0 | 56.3 | 12.4 | 21.8 | 0.1 | 0.0 | 0.0 | 0.0 |
2.4 |
0.0 | 30.0 |
| Final bound rate 2003 |
12.3 |
1.2 | 7.1 | 56.0 | 11.7 | 21.8 | 0.1 | 0.0 | 0.0 | 0.0 |
2.4 |
0.0 | 30.0 | |
|
Latvia |
Bound rate at accession 1999 |
35.8 |
1.5 | 1.6 | 16.7 | 9.6 | 2.4 | 5.9 | 2.9 | 57.5 | 1.5 |
0.4 |
0.0 | 100.0 |
| Final bound rate 2008 |
34.6 |
2.1 | 1.6 | 19.0 | 9.1 | 3.2 | 3.5 | 5.3 | 54.3 | 1.3 |
0.4 |
0.0 | 55.0 | |
|
Estonia |
Bound rate at accession 1999 |
19.2 |
8.1 | 7.8 | 23.6 | 11.5 | 15.5 | 18.3 | 7.2 | 7.4 | 0.6 |
0.0 |
0.0 | 59.0 |
| Final bound rate 2004 |
17.5 |
17.0 | 6.2 | 21.5 | 11.1 | 12.5 | 17.7 | 6.2 | 7.1 | 0.6 |
0.0 |
0.0 | 59.0 | |
|
Jordan |
Bound rate at accession 2000 |
25.8 |
0.9 | 13.1 | 11.9 | 12.2 | 10.5 | 46.2 | 1.0 | 0.0 | 3.5 |
1.0 |
0.0 | 200.0 |
| Final bound rate 2010 |
23.7 |
0.9 | 13.1 | 12.7 | 15.5 | 23.6 | 29.2 | 0.9 | 0.0 | 3.5 |
1.0 |
0.0 | 200.0 | |
|
Georgia |
Bound rate at accession 2000 |
13.3 |
0.0 | 0.9 | 0.1 | 85.4 | 6.6 | 4.4 | 0.0 | 0.0 | 0.0 |
2.5 |
4.0 | 30.0 |
| Final bound rate 2006 |
11.7 |
8.3 | 1.5 | 7.4 | 69.5 | 6.9 | 4.0 | 0.0 | 0.0 | 0.0 |
2.5 |
0.0 | 30.0 | |
|
Albania |
Bound rate at accession 2000 |
10.8 |
0.4 | 17.8 | 59.4 | 3.4 | 18.9 | 0.0 | 0.0 | 0.0 | 0.0 |
0.0 |
0.0 | 20.0 |
| Final bound rate 2007 |
9.4 |
10.9 | 17.3 | 54.9 | 1.8 | 15.2 | 0.0 | 0.0 | 0.0 | 0.0 |
0.0 |
0.0 | 20.0 | |
|
Oman |
Bound rate at accession 2000 |
28.1 |
0.0 | 6.9 | 5.2 | 76.3 | 0.1 | 0.0 | 0.0 | 1.2 | 10.3 |
0.0 |
5.0 | 200.0 |
| Final bound rate 2006 |
28.0 |
0.0 | 8.0 | 6.6 | 73.7 | 0.1 | 0.0 | 0.0 | 1.2 | 10.3 |
0.0 |
5.0 | 200.0 | |
|
Croatia |
Bound rate at accession 2000 |
13.0 |
13.0 | 24.6 | 13.1 | 15.9 | 9.7 | 3.7 | 3.8 | 3.1 | 3.2 |
18.3 |
0.0 | 90.0 |
| Final bound rate 2007 |
9.4 |
15.1 | 27.4 | 15.5 | 16.4 | 8.7 | 2.4 | 4.4 | 0.1 | 0.0 |
18.3 |
0.0 | 55.0 | |
|
Lithuania |
Bound rate at accession 2001 |
16.3 |
9.1 | 13.6 | 31.7 | 14.7 | 4.0 | 11.5 | 6.0 | 4.6 | 1.5 |
3.4 |
0.0 | 100.0 |
| Final bound rate 2009 |
15.2 |
9.7 | 13.7 | 31.9 | 16.1 | 5.2 | 12.2 | 4.0 | 3.4 | 1.0 |
3.0 |
0.0 | 100.0 | |
|
Moldova |
Bound rate at accession 2001 |
18.1 |
0.4 | 6.9 | 28.5 | 11.2 | 11.4 | 25.2 | 8.0 | 0.0 | 0.0 |
8.3 |
0.0 | 40.0 |
| Final bound rate 2005 |
12.2 |
3.0 | 8.3 | 32.7 | 35.7 | 11.8 | 0.1 | 0.0 | 0.0 | 0.0 |
8.3 |
0.0 | 25.0 | |
|
China |
Bound rate at accession 2000 |
20.6 |
2.7 | 9.4 | 14.3 | 16.5 | 14.7 | 26.1 | 8.6 | 3.1 | 4.6 |
0.0 |
0.0 | 74.0 |
| Final bound rate 2010 |
15.8 |
2.8 | 11.1 | 25.2 | 24.9 | 18.6 | 12.1 | 2.2 | 0.6 | 2.5 |
0.0 |
0.0 | 65.0 | |
|
Chinese Taipei |
Bound rate at accession 2002 |
17.2 |
22.9 | 16.5 | 10.9 | 8.3 | 18.4 | 12.1 | 1.6 | 0.7 | 3.8 |
8.6 |
0.0 | 800.0 |
| Final bound rate 2011 |
15.3 |
24.6 | 15.9 | 11.5 | 10.3 | 17.6 | 9.9 | 1.5 | 0.1 | 3.8 |
8.6 |
0.0 | 500.0 | |
|
Armenia |
Bound rate at accession 2003 |
14.7 |
1.3 | 0.4 | 1.0 | 97.2 | 0.0 | 0.0 | 0.0 | 0.0 | 0.0 |
0.0 |
0.0 | 15.0 |
| Final bound rate 2003 |
14.7 |
1.3 | 0.4 | 1.0 | 97.2 | 0.0 | 0.0 | 0.0 | 0.0 | 0.0 |
0.0 |
0.0 | 15.0 | |
|
FYROM |
Bound rate at accession 2003 |
13.7 |
31.0 | 16.1 | 7.7 | 7.2 | 6.1 | 6.8 | 6.1 | 7.7 | 2.6 |
10.1 |
0.0 | 60.0 |
| Final bound rate 2007 |
11.3 |
34.0 | 15.9 | 8.2 | 8.7 | 6.7 | 7.7 | 5.1 | 4.3 | 0.6 |
10.0 |
0.0 | 60.0 | |
|
Nepal |
Bound rate at accession 2003 |
50.1 |
0.0 | 0.0 | 2.3 | 0.3 | 0.7 | 3.6 | 3.6 | 77.4 | 12.0 |
0.0 |
10.0 | 200.0 |
| Final bound rate 2006 |
41.4 |
0.0 | 0.7 | 2.3 | 0.4 | 4.2 | 28.7 | 33.7 | 21.4 | 8.5 |
0.0 |
5.0 | 200.0 | |
|
Cambodia |
Bound rate at accession 2003 |
28.2 |
0.0 | 2.8 | 6.9 | 17.1 | 11.4 | 16.4 | 43.5 | 0.9 | 0.9 |
0.0 |
5.0 | 60.0 |
| Final bound rate 2011 |
28.1 |
0.0 | 2.8 | 7.1 | 17.6 | 11.2 | 16.4 | 43.1 | 0.9 | 0.9 |
0.0 |
5.0 | 60.0 | |
|
Saudi Arabia |
Bound rate at accession 2005 |
12.5 |
0.0 | 3.6 | 32.3 | 51.6 | 2.3 | 1.7 | 0.1 | 0.0 | 0.1 |
10.7 |
0.0 | 200.0 |
| Final bound rate 2010 |
12.4 |
0.0 | 3.6 | 32.4 | 52.4 | 3.0 | 0.6 | 0.1 | 0.0 | 0.1 |
10.1 |
0.0 | 200.0 | |
|
Viet Nam |
Bound rate at accession 2007 |
22.4 |
6.9 | 16.0 | 16.9 | 7.8 | 13.7 | 10.8 | 20.5 | 3.2 | 4.0 |
0.0 |
0.0 | 150.0 |
| Final bound rate 2014 |
18.5 |
6.9 | 17.2 | 20.7 | 9.8 | 14.6 | 14.9 | 11.8 | 1.6 | 2.5 |
0.0 |
0.0 | 135.0 | |
|
Tonga |
Bound rate at accession 2007 |
19.7 |
0.0 | 0.0 | 0.0 | 15.6 | 68.0 | 11.4 | 0.0 | 0.0 | 0.0 |
5.0 |
15 | 25 |
| Final bound rate 2007 |
19.2 |
0.0 | 0.0 | 0.0 | 16.4 | 83.6 | 0.0 | 0.0 | 0.0 | 0.0 |
0.0 |
15 | 20 | |
Results of the negotiations non-agricultural products
Acceding governments have generally bound 100 percent of their non-agricultural tariffs.
The key results of the negotiations are the final bound rates accepted by new Members. In the non-agricultural sector, the simple average of final bound rates for the newly acceded Members has ranged from 4.8 percent449 to 23.7 percent450, significantly lower than in the agricultural sector (see Table 6 below). At first sight, no very clear pattern emerges. However, the results fall into four groups: (i) the four countries that first acceded (because the WTO accession process was still being established and most of the concessions were negotiated during the Uruguay Round of trade negotiations); (ii) the two LDCs, Cambodia and Nepal, with 17.7 percent and 23.7 percent; (iii) three developing countries, Tonga, Jordan and Oman, at between 11.6 percent and 17.3 percent and (iv) 14 other new Members that all bound the average of their tariffs between 4.8 percent and 10.7 percent.
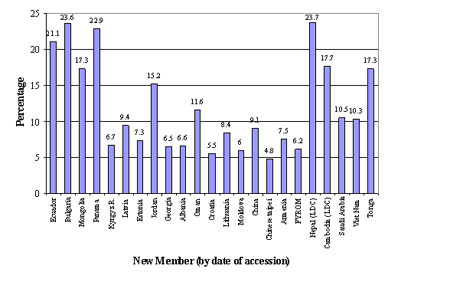
Table 7 provides more detail and shows that, as in the agricultural sector, some of the distribution of individual rates around the average is much greater in the tariffs of some countries than in others. The highest final bound rate in the non-agricultural tariff of six of the new Members is 20 percent. The highest individual final bound rate is 90 percent but final bound rates of more than 50 percent are quite exceptional.
For several applicants, the final bound rates were significantly lower than the bound rates at the date of accession. As in the agricultural sector, the length of these periods varies up to 12 years.
Only four new Members apply non ad valorem duties and in each of these cases these account for less than one percent of their final bound tariffs.
| Reduction commitments | Simple average of ad valorem tariff bindings (percent) | Distribution of ad valorem tariff bindings ( percent) | Share of non ad valorem tariff bindings (percent) | Min. ad valorem duty | Max. ad valorem duty | |||||||||
| 0 (duty-free) | 0.1-5.0 | 5.1-10.0 | 10.1-15.0 | 15.1-20.0 | 20.1-30.0 | 30.1-40.0 | 40.1-50.0 | 50.1+ | ||||||
|
Ecuador |
Bound rate at accession 1995 | 21.1 | 0.0 | 1.9 | 15.8 | 12.4 | 21.3 | 48.2 | 0.2 | 0.0 | 0.0 | 0.0 | 5.0 | 40.0 |
| Final bound rate 2001 | 21.1 | 0.0 | 1.9 | 15.8 | 12.4 | 21.3 | 48.2 | 0.2 | 0.0 | 0.0 | 0.0 | 5.0 | 40.0 | |
|
Bulgaria |
Bound rate at accession 1997 | 25.7 | 0.3 | 4.0 | 15.2 | 9.2 | 4.8 | 16.6 | 49.9 | 0.0 | 0.0 | 0.0 | 0.0 | 40.0 |
| Final bound rate 2005 | 23.6 | 1.8 | 5.9 | 18.2 | 15.3 | 3.4 | 5.7 | 49.6 | 0.0 | 0.0 | 0.0 | 0.0 | 40.0 | |
|
Mongolia |
Bound rate at accession 1996 | 19.2 | 0.6 | 0.0 | 1.1 | 19.7 | 74.5 | 3.9 | 0.0 | 0.0 | 0.0 | 0.0 | 0.0 | 30.0 |
| Final bound rate 2010 | 17.3 | 1.6 | 0.0 | 19.8 | 0.0 | 74.5 | 3.9 | 0.0 | 0.0 | 0.0 | 0.0 | 0.0 | 30.0 | |
|
Panama |
Bound rate at accession 1997 | 31.6 | 1.2 | 3.7 | 4.6 | 6.1 | 12.8 | 5.0 | 66.5 | 0.0 | 0.0 | 0.0 | 0.0 | 90.0 |
| Final bound rate 2011 | 22.9 | 2.2 | 3.6 | 18.7 | 4.6 | 2.6 | 68.0 | 0.1 | 0.0 | 0.0 | 0.0 | 0.0 | 81.0 | |
|
Kyrgyz Republic |
Bound rate at accession 1998 | 11.8 | 2.4 | 4.8 | 64.1 | 11.6 | 15.3 | 1.2 | 0.0 | 0.5 | 0.0 | 0.0 | 0.0 | 50.0 |
| Final bound rate 2005 | 6.7 | 22.5 | 10.5 | 58.9 | 7.8 | 0.0 | 0.0 | 0.0 | 0.0 | 0.0 | 0.2 | 0.0 | 20.0 | |
|
Latvia |
Bound rate at accession 1999 | 10.8 | 3.4 | 9.1 | 59.3 | 18.0 | 6.8 | 2.1 | 0.1 | 0.9 | 0.3 | 0.0 | 0.0 | 55.0 |
| Final bound rate 2008 | 9.4 | 16.1 | 6.6 | 51.5 | 17.5 | 6.7 | 0.3 | 0.0 | 0.9 | 0.3 | 0.0 | 0.0 | 55.0 | |
|
Estonia |
Bound rate at accession 1999 | 7.6 | 12.6 | 15.1 | 61.3 | 9.9 | 0.3 | 0.8 | 0.0 | 0.0 | 0.0 | 0.0 | 0.0 | 30.0 |
| Final bound rate 2005 | 7.3 | 18.5 | 11.2 | 59.3 | 9.9 | 0.3 | 0.8 | 0.0 | 0.0 | 0.0 | 0.0 | 0.0 | 30.0 | |
|
Jordan |
Bound rate at accession 2000 | 19.2 | 3.0 | 20.1 | 11.2 | 6.8 | 12.8 | 43.2 | 2.8 | 0.0 | 0.0 | 0.1 | 0.0 | 35.0 |
| Final bound rate 2010 | 15.2 | 6.3 | 19.5 | 16.3 | 11.1 | 24.1 | 22.7 | 0.0 | 0.0 | 0.0 | 0.1 | 0.0 | 30.0 | |
|
Georgia |
Bound rate at accession 2000 | 10.2 | 1.3 | 22.6 | 1.6 | 73.8 | 0.6 | 0.0 | 0.0 | 0.0 | 0.0 | 0.0 | 0.0 | 20.0 |
| Final bound rate 2005 | 6.5 | 23.6 | 20.6 | 23.4 | 32.0 | 0.3 | 0.0 | 0.0 | 0.0 | 0.0 | 0.0 | 0.0 | 20.0 | |
|
Albania |
Bound rate at accession 2000 | 10.1 | 3.9 | 44.4 | 23.1 | 0.3 | 28.2 | 0.0 | 0.0 | 0.0 | 0.0 | 0.0 | 0.0 | 20.0 |
| Final bound rate 2009 | 6.6 | 28.4 | 34.5 | 19.1 | 2.4 | 15.5 | 0.0 | 0.0 | 0.0 | 0.0 | 0.0 | 0.0 | 20.0 | |
|
Oman |
Bound rate at accession 2000 | 14.7 | 1.5 | 0.9 | 2.7 | 92.7 | 2.2 | 0.0 | 0.0 | 0.0 | 0.0 | 0.0 | 0.0 | 20.0 |
| Final bound rate 2009 | 11.6 | 4.1 | 8.5 | 24.4 | 60.7 | 2.2 | 0.0 | 0.0 | 0.0 | 0.0 | 0.0 | 0.0 | 20.0 | |
|
Croatia |
Bound rate at accession 2000 | 6.7 | 22.9 | 34.4 | 23.0 | 12.7 | 6.7 | 0.2 | 0.0 | 0.0 | 0.0 | 0.0 | 0.0 | 38.0 |
| Final bound rate 2005 | 5.5 | 26.5 | 36.9 | 22.9 | 13.3 | 0.3 | 0.0 | 0.0 | 0.0 | 0.0 | 0.0 | 0.0 | 25.0 | |
|
Lithuania |
Bound rate at accession 2001 | 8.7 | 24.5 | 7.0 | 31.9 | 28.4 | 6.7 | 1.4 | 0.2 | 0.0 | 0.0 | 0.0 | 0.0 | 35.0 |
| Final bound rate 2009 | 8.4 | 24.5 | 7.1 | 36.0 | 24.7 | 6.7 | 1.0 | 0.0 | 0.0 | 0.0 | 0.0 | 0.0 | 30.0 | |
|
Moldova |
Bound rate at accession 2001 | 11.1 | 22.7 | 11.7 | 31.4 | 7.5 | 11.9 | 6.9 | 7.9 | 0.0 | 0.0 | 0.0 | 0.0 | 40.0 |
| Final bound rate 2005 | 6.0 | 25.6 | 16.9 | 46.4 | 11.0 | 0.1 | 0.0 | 0.0 | 0.0 | 0.0 | 0.0 | 0.0 | 20.0 | |
|
China |
Bound rate at accession 2000 | 12.7 | 1.8 | 10.4 | 35.2 | 21.0 | 12.1 | 17.7 | 1.3 | 0.2 | 0.3 | 0.0 | 0.0 | 61.7 |
| Final bound rate 2010 | 9.1 | 6.2 | 18.1 | 47.0 | 15.3 | 8.7 | 3.9 | 0.5 | 0.2 | 0.0 | 0.0 | 0.0 | 50.0 | |
|
Chinese Taipei |
Bound rate at accession 2002 | 6.4 | 13.2 | 44.7 | 25.3 | 12.0 | 2.5 | 0.9 | 0.3 | 0.1 | 0.5 | 0.9 | 0.0 | 106.0 |
| Final bound rate 2011 | 4.8 | 29.0 | 39.9 | 21.0 | 7.8 | 0.7 | 0.5 | 0.1 | 0.0 | 0.3 | 0.9 | 0.0 | 90.0 | |
|
Armenia |
Bound rate at accession 2003 | 7.7 | 38.6 | 7.6 | 10.4 | 43.4 | 0.0 | 0.0 | 0.0 | 0.0 | 0.0 | 0.0 | 0.0 | 15.0 |
| Final bound rate 2007 | 7.5 | 39.2 | 7.8 | 11.1 | 41.8 | 0.0 | 0.0 | 0.0 | 0.0 | 0.0 | 0.0 | 0.0 | 15.0 | |
|
The former Yugoslav Republic of Macedonia |
Bound rate at accession 2003 | 9.5 | 23.4 | 23.8 | 18.7 | 11.4 | 7.4 | 8.9 | 6.5 | 0.0 | 0.0 | 0.2 | 0.0 | 32.2 |
| Final bound rate 2012 | 6.2 | 36.2 | 20.3 | 21.2 | 13.9 | 7.5 | 1.0 | 0.0 | 0.0 | 0.0 | 0.2 | 0.0 | 25.0 | |
|
Nepal |
Bound rate at accession 2003 | 39.4 | 0.1 | 1.2 | 0.7 | 1.4 | 2.4 | 20.6 | 39.4 | 28.0 | 5.4 | 0.0 | 0.0 | 130.0 |
| Final bound rate 2013 | 23.7 | 3.1 | 1.1 | 2.9 | 5.3 | 34.5 | 48.6 | 3.5 | 0.2 | 0.1 | 0.0 | 0.0 | 60.0 | |
|
Cambodia |
Bound rate at accession 2003 | 17.7 | 0.7 | 0.0 | 28.9 | 29.9 | 17.0 | 8.8 | 14.6 | 0.0 | 0.0 | 0.0 | 0.0 | 42.5 |
| Final bound rate 2013 | 17.7 | 1.0 | 0.0 | 28.8 | 29.7 | 17.1 | 8.8 | 14.6 | 0.0 | 0.0 | 0.0 | 0.0 | 42.5 | |
|
Saudi Arabia |
Bound rate at accession 2005 | 10.9 | 1.7 | 9.8 | 32.2 | 55.2 | 1.1 | 0.0 | 0.0 | 0.0 | 0.0 | 0.0 | 0.0 | 20.0 |
| Final bound rate 2015 | 10.5 | 5.6 | 6.6 | 34.4 | 53.0 | 0.4 | 0.0 | 0.0 | 0.0 | 0.0 | 0.0 | 0.0 | 20.0 | |
|
Viet Nam |
Bound rate at accession 2007 | 13.1 | 12.7 | 25.8 | 19.4 | 12.4 | 11.2 | 11.0 | 6.1 | 1.0 | 0.5 | 0.1 | 0.0 | 100.0 |
| Final bound rate 2019 | 10.3 | 14.3 | 32.8 | 14.1 | 13.8 | 14.4 | 8.5 | 1.3 | 0.4 | 0.4 | 0.1 | 0.0 | 100.0 | |
|
Tonga |
Bound rate at accession 2007 | 19.4 | 0.0 | 0.0 | 0.0 | 27.6 | 62.4 | 7.0 | 1.8 | 1.3 | 0.0 | 0.0 | 15.0 | 45.0 |
| Final bound rate 2007 | 17.3 | 0.0 | 0.0 | 0.0 | 53.0 | 47.0 | 0.0 | 0.0 | 0.0 | 0.0 | 0.0 | 15.0 | 20.0 | |
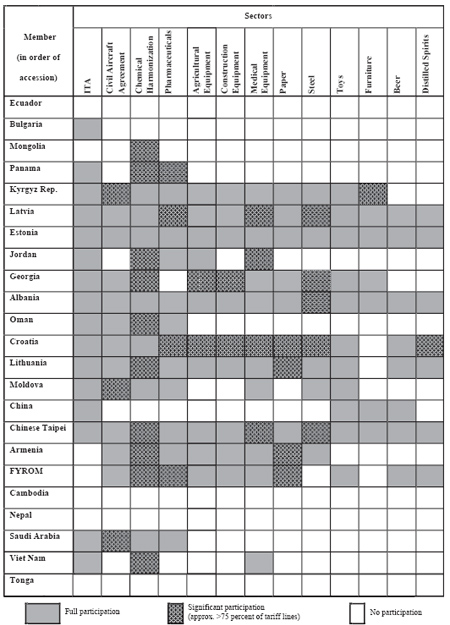
The number of zero bindings made by new Members reflect in part that most acceders have agreed to join zero for zero initiatives, or to become a participant in the Information Technology Agreement (ITA).
The informal zero for zero initiatives were negotiated plurilaterally among interested countries during the Uruguay Round and led to an agreement among the countries concerned to bind their tariffs on products in a number of sectors at zero and extend the benefits on an MFN basis. The sectors concerned are: pharmaceuticals, agricultural equipment, construction equipment, medical equipment, paper, steel, toys, furniture, beer and distilled spirits. An agreement to harmonize tariffs on chemical products was also concluded on a similar basis. An indicative list of the products included in these sectors is at Annex 15.
The Information Technology Agreement is a later development.452 This is a formal agreement providing that tariffs and other duties and charges on the covered products must be bound at zero in the Schedules. There are no exceptions to product coverage but an extended implementation period for sensitive items is foreseen. The number of participants is now 70453, representing about 97 percent of world trade in information technology products.
As noted above, some new Members have joined the Civil Aircraft Agreement which requires them, inter alia, to bind their tariffs on covered items at zero. Some other acceders have not joined the Agreement but have nevertheless bound civil aircraft tariffs at zero.
During the bilateral tariff negotiations, some WTO Members ask applicants to join these sectoral initiatives. Table 8 shows that neither Tonga, nor the two LDCs have fully participated in any of the sectoral initiatives. It also demonstrates that most acceders have joined the ITA. One acceder participated in all 13 initiatives.454 In many cases, acceders made commitments in a significant number of tariff lines corresponding to particular tariff initiatives, but did not fully participate in these initiatives.
Notes:
444. WTO document WT/L/508.
back to text
445. Data on the duties applied during the base period for the negotiations are not available. Table 3 shows the nearest approximation to this that is available.
back to text
446. With some exceptions, for example, Saudi Arabia prohibits importation and domestic production of some items for religious reasons.
back to text
447. Albania and Croatia.
back to text
448. Nepal. back to text
449. Chinese Taipei. back to text
450. Nepal. back to text
451. Source: WT/ACC/10/Rev. 3, pp. 22 and 23.
To improve cross-country comparability, tariff profiles are compiled at the HS 6-digit level product classification, which offers a common structure that is not biased by the different levels of disaggregation in
Members tariffs. As a result of the HS 6-digit aggregation, double-counting may occur, which could affect the percentage distribution of tariff bindings (which may not necessarily add up to 100 percent). Minimum/maximum ad valorem duties, however, are compiled at the level of the national nomenclature. back to text
452. Ministerial Declaration on Trade in IT Products, 13 December 1996 WTO document WT/MIN(96)/16. This contains a list of the products covered.
back to text
453. August, 2007. back to text
454. Estonia. back to text
![]()
![]()
Chapters done: