IX. Statistical tables
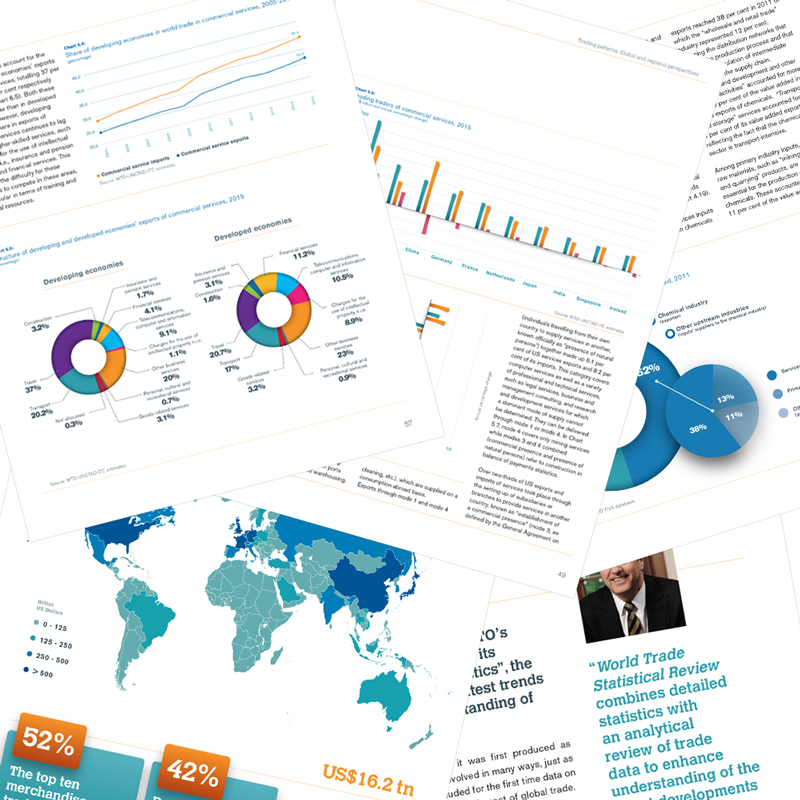
The complete publication “World trade statistical review 2016” can be ordered from the WTO online bookshop.The charts and tables from this chapter can be downloaded by clicking the links below.
See also:
> News item
> Statistics Database
> World Trade Statistical Review and tariff data
Table of Contents
I. Introduction
II. Trends in world trade: Looking back over the past ten years
> Charts and tables
III. World trade in 2015-16
> Charts and tables
IV. Trade in goods and services
> Charts and tables
V. Trading patterns: Global and regional perspectives
> Charts and tables
VI. Developing economies' participation in global trade
> Charts and tables
VII. Trade policy developments
> Charts and tables
VIII. Composition, definitions & methodology
IX. Statistical tables
> Tables
> All Excel tables in zip format
Copyright:
Permission to make digital or hard copies of any information contained in these web pages is granted for personal or classroom use, without fee and without formal request.
Full citation and copyright notice must appear on the first page.
Copies may not be made or distributed for profit or commercial advantage.
To republish, to post on servers, or to redistribute to lists, requires prior specific permission and/or fee.
Table A1: Growth in the volume of world merchandise exports and production, 2010-2015
Table A2: Growth in the volume of world merchandise trade by selected region and economy, 2010-2015
Table A3: World merchandise trade and trade in commercial services by region and selected economy, 2010-2015
Table A4: World merchandise exports by region and selected economy, 1948, 1953, 1963, 1973, 1983, 1993, 2003 and 2015
Table A5: World merchandise imports by region and selected economy, 1948, 1953, 1963, 1973, 1983, 1993, 2003 and 2015
Table A6: Leading exporters and importers in world merchandise trade, 2015
Table A7: Leading exporters and importers in world merchandise trade (excluding intra-EU (28) trade), 2015
Table A8: Leading exporters and importers in world trade in commercial services, 2015
Table A9: Leading exporters and importers in world trade in commercial services (excluding intra-EU (28) trade), 2015
Table A10: Trade in commercial services of selected economies by origin and destination, 2014
Table A11: Ratio of exports of goods and commercial services to GDP of the least-developed countries, 2015
Table A12: Merchandise exports and imports of least-developed countries, 2015
Table A13: Exports of commercial services of the least-developed countries by category, 2015
Table A14: Top 10 exporters and importers of agricultural products, 2015
Table A15: Top 10 exporters and importers of fuels and mining products of regions by destination, 2015
Table A16: Top 10 exporters and importers of manufactures, 2015
Table A17: Top 10 exporters and importers of iron and steel, 2015
Table A18: Top 10 exporters and importers of chemicals, 2015
Table A19: Top 10 exporters and importers of pharmaceuticals, 2015
Table A20: Top 10 exporters and importers of office and telecom equipment, 2015
Table A21: Top 10 exporters and importers of automotive products, 2015
Table A22: Top 10 exporters and importers of textiles, 2015
Table A23: Top 10 exporters and importers of clothing, 2015
Table A24: World trade in commercial services by category, 2015
Table A25: Growth of commercial services exports by category and by region, 2005-2015
Table A26: World trade in transportation services by region, 2015
Table A27: Leading exporters and importers of transportation services, 2015
Table A28: Major exporters and importers of manufacturing services on physical inputs owned by others, 2014 and 2015
Table A29: Major exporters and importers of maintenance and repair services, 2015
Table A30: World trade in transport services by region, 2015
Table A31: Leading exporters and importers of transport services, 2015
Table A32: World trade in travel by region, 2015
Table A33: Leading exporters and importers of travel, 2015
Table A34: World trade in other commercial services by region, 2015
Table A35: Leading exporters and importers of other commercial services, 2015
Table A36: World exports of construction by region, 2014 and 2015
Table A37: Major exporters and importers of construction, 2014 and 2015
Table A38: World exports of insurance and pension services by region, 2014 and 2015
Table A39: Major exporters and importers of insurance and pension services, 2015 and 2015
Table A40: World exports of financial services by region, 2014 and 2015
Table A41: Major exporters and importers of financial services, 2014 and 2015
Table A42: World receipts of charges for the use of intellectual property n.i.e. by region, 2014 and 2015
Table A43: Major exporters and importers of charges for the use of intellectual property n.i.e. by region, 2014 and 2015
Table A44: World exports of telecommunications, computer and information services by region, 2014 and 2015
Table A45: Major exporters and importers of telecommunications, computer and information services, 2014 and 2015
Table A46: Major exporters and importers of telecommunications services, 2014 and 2015
Table A47: Major exporters and importers of computer services, 2014 and 2015
Table A48: World exports of other business services by region, 2014 and 2015
Table A49: Major exporters and importers of other business services, 2014 and 2015
Table A50: Trade in other business services by category in selected economies, major economies, 2014
Table A51: World exports of personal, cultural and recreational services by region, 2014 and 2015
Table A52: Major exporters and importers of personal, cultural and recreational services, 2014 and 2015
Table A53: Major exporters and importers of audio-visual and related services, 2014 and 2015
Table A54: Leading exporters and importers of intermediate goods, 2015
Table A55: World merchandise exports, production and gross domestic product, 1950-2015
Table A56: Merchandise trade of selected regional trade agreements, 2005-2015
Table A57: Trade in commercial services by selected groups of economies, 2006-2015
Table A58: World merchandise exports by region and selected economy, 2005-2015
Table A59: World merchandise imports by region and selected economy, 2005-2015
Table A60: World exports of commercial services by region and selected economy, 2006-2015
Table A61: World imports of commercial services by region and selected economy, 2006-2015
Table A62: Sales by affiliates of foreign companies - resident affiliates primarily engaged in services activities (inward FATS), 2011-2013
Table A63: Sales by foreign affiliates of resident companies - affiliates located abroad primarily engaged in services activities (outward FATS), 2011-2013
Table A64: Services supplied by United States affiliates established abroad (outward FATS) and by foreign affiliates in the United States (inward FATS) by economy of affiliate, 2013
Table A65: World merchandise exports of intermediate goods by region and selected economy, 2004-2014
Table A66: World merchandise imports of intermediate goods by region and selected economy, 2004-2014
Table A67: Export prices of primary commodities, 2005-2016
Table A68: Export prices of Germany, Japan and the United States by commodity group, 2005-2015
Table A69: Import prices of Germany, Japan and the United States by commodity group, 2005-2015

> Download the complete World Trade Statistics 2016 file in pdf format
> Order paper version from online bookshop
Any feedback on this page should be sent to [email protected]
